Product
Everything the collector and hub do
Discovery, monitoring, dashboards and alerts at every site, and one hub to see them all. Here is the full list, by area.
The published images are version 1.2.0; some features here come with the next release. The release history says which.
Discovery
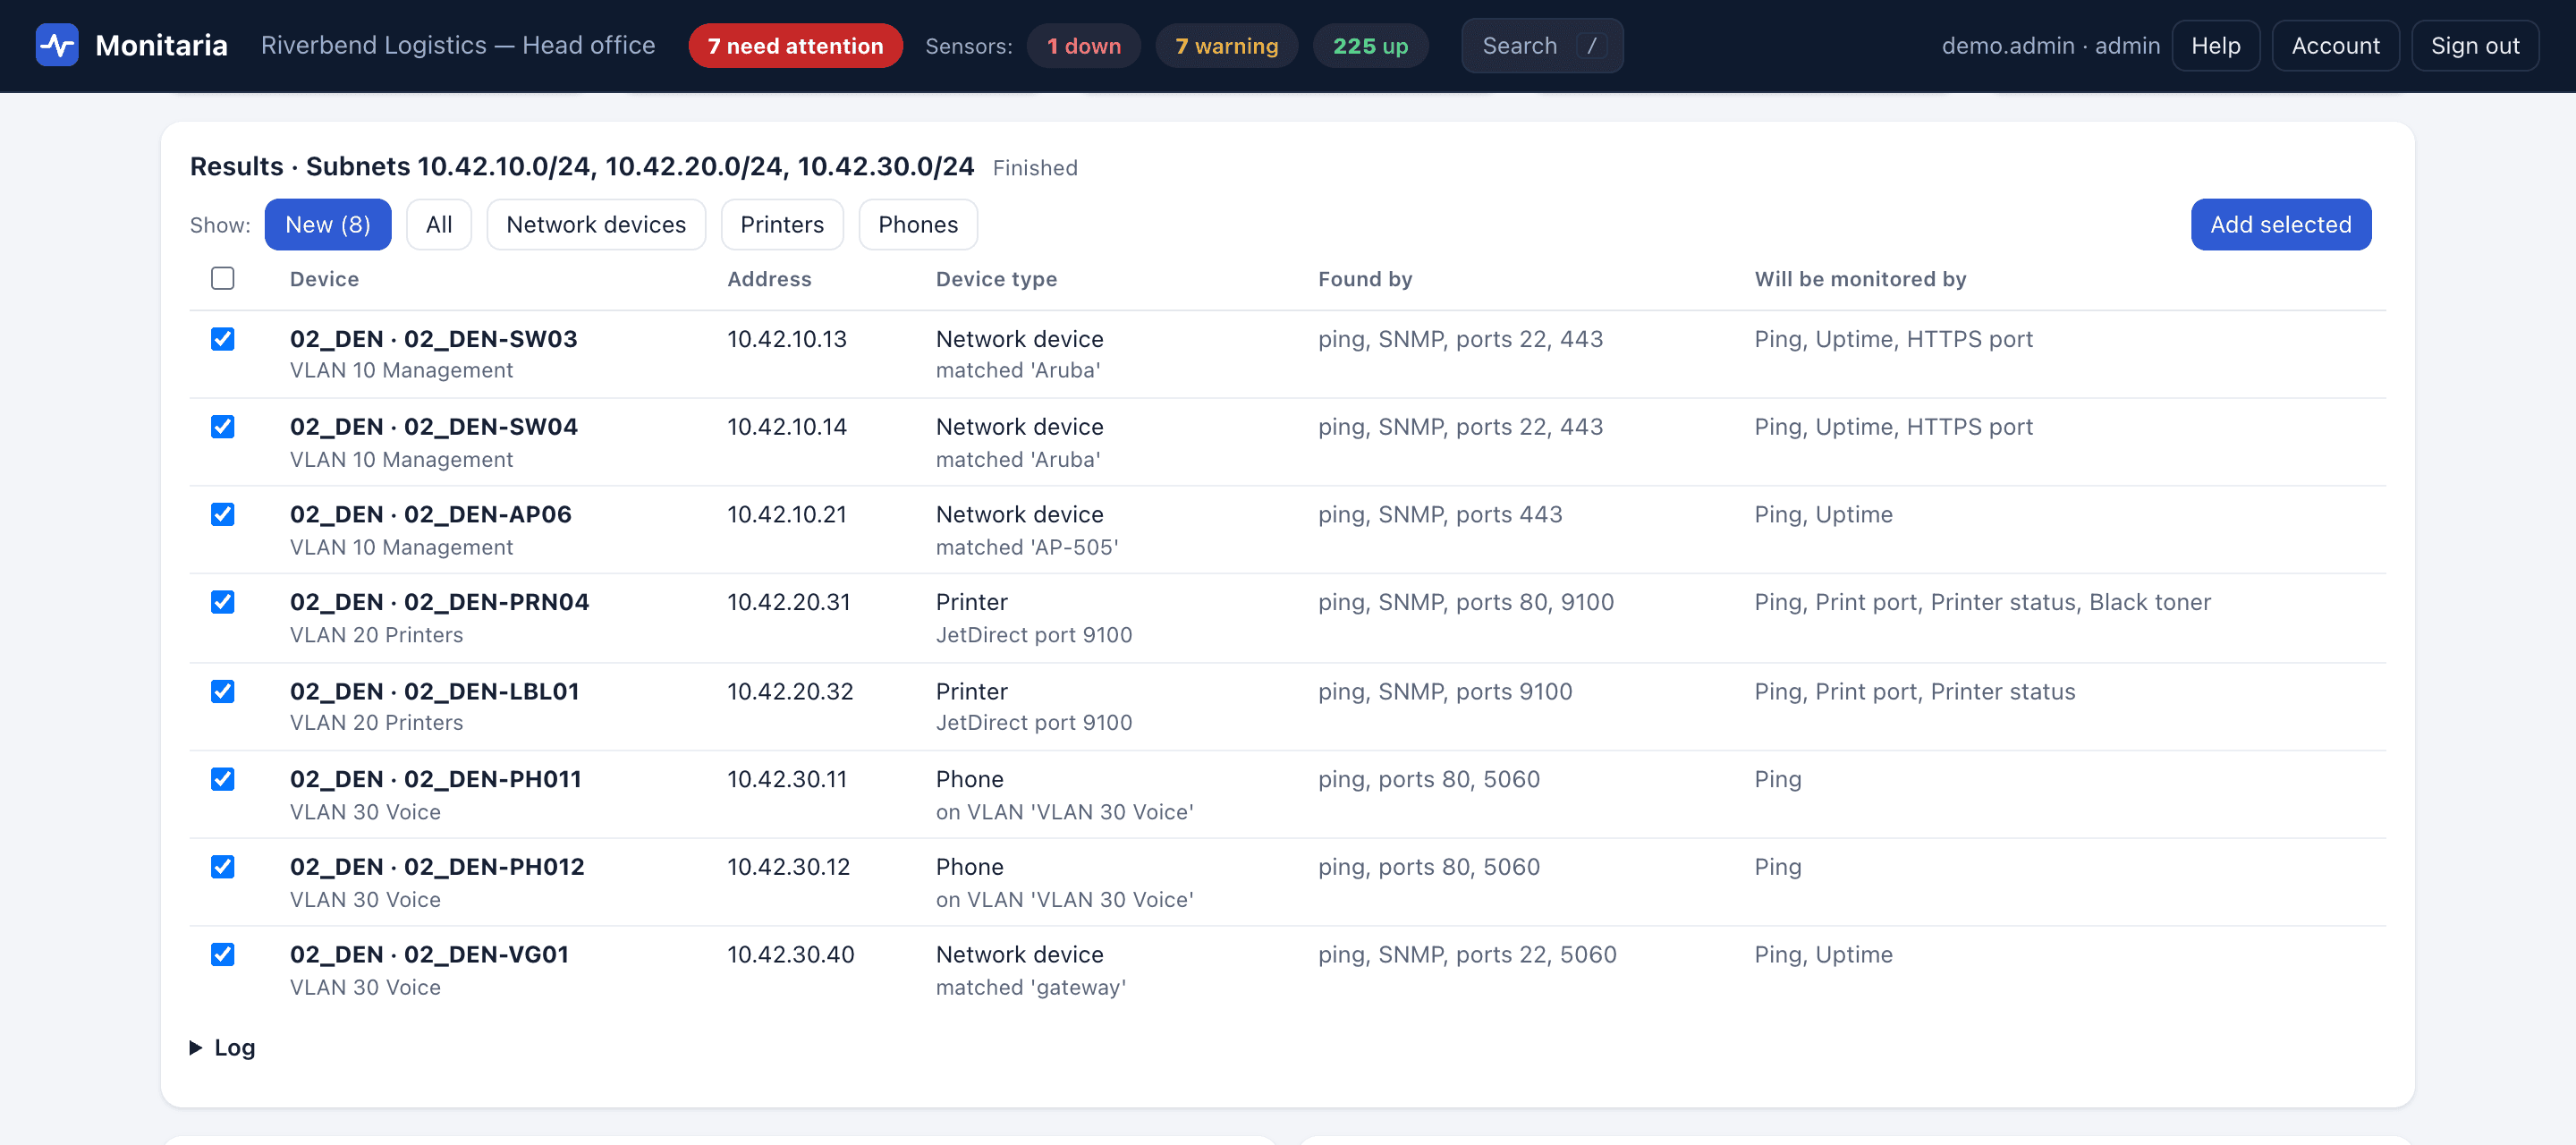
Discovery is on by default: a new collector scans its own network the first time it starts. Everything else is one click away.
- This network: Scans the network the collector is on. A new collector does this by itself on first start.
- Networks behind the router: Reads the router's networks over SNMP so you can pick which VLANs to scan.
- Neighbors: Uses CDP/LLDP on monitored gear to find access points, switches, controllers and hypervisors plugged into it.
- Other sites: Reads each site router's VLANs over SNMP and scans them across the WAN.
- Any subnet: Enter a subnet and scan it.
- Results come back as a checklist: tick the devices you want and add them.
- Scanned networks are re-checked on a schedule. New devices are listed for review, or added automatically if you prefer.
- Duplicate addresses of the same router or switch are recognized as one device.
- Generic devices get their real names from CDP/LLDP.
Monitoring & checks
Checks run on the collector, inside the site network, and for services on the internet.
- Websites: status over HTTP or HTTPS, response time, and required text on the page.
- TLS certificates: days until the certificate expires.
- DNS records: records resolve as expected.
- TCP ports: the service is listening.
- Ping: reachability and round-trip time.
- SNMP v1, v2c and v3: interface bandwidth from counters, device uptime, and printer status and toner levels. SNMPv3 with SHA-1, SHA-2 or MD5 authentication and AES or DES privacy.
- Windows servers over WinRM: CPU, memory, disks, services, uptime and update age, with an inventory of hardware, software and antivirus.
- NetFlow v5/v9 and IPFIX: top talkers, conversations, applications and interfaces from your routers and firewalls, with alerts on traffic. Flow data stays on the collector.
- Test runs a check before you save it. Adding a website adds its certificate check too.
- Warn and down thresholds per sensor.
- Fewer false alarms: a sensor only goes down after N failures in a row, and a threshold warning (such as one slow ping) has to repeat, twice by default, before it counts.
Dashboards
The overview opens with the network health score: the share of devices that are fully up, with warnings counting as half. Five built-in templates follow common NOC practice.
- Network health: health score, key numbers, status by device type, sites, problems, 24-hour availability, slowest links and recent changes.
- Executive summary: health score, availability over 24 hours and 7 days, sites, and devices by type.
- Printers & supplies: fleet health, lowest toner first, and the printers that need attention.
- Endpoints: computers, laptops and mobiles by site, plus IP phones and the ones that are down.
- Servers & services: server health, certificate expiry, and the slowest websites.
- Admins can add, remove, reorder and resize widgets.
- Filter widgets by device type, site, check or period.
- Create new dashboards from a template or start from a blank one.
Devices & grouping
Devices are grouped by type and by site, with filter chips, search and a problems-only view.
- Computers, laptops, tablets and phones are monitored for presence. One that isn't seen shows as offline rather than down, raises no alert and doesn't lower the health score.
- Endpoint names come from NetBIOS, mDNS and DNS.
- Connect: open a device's web page, SSH or Remote Desktop straight from its dialog or the map, worked out from its sensors. The links hold no user name or password, so the device's own sign-in still applies.
- Show on map: jump from any device or sensor to the map, zoomed to the device, ringed and named.
Device types
- Routers
- Switches
- Firewalls
- Wi-Fi access points
- Wireless controllers
- Voice gateways
- IP phones
- Printers
- Servers
- UPS & power
- Cameras
- Computers & laptops
- Phones & tablets
- Websites & services
Alerts
Alerts go out from the collector itself, so they don't depend on the hub.
- Webhook alerts that work with Slack and Microsoft Teams incoming webhooks.
- Because a sensor needs N failures in a row before it goes down, a single dropped packet doesn't page anyone.
- Endpoints going offline never raise an alert.
Hub & multi-site
The hosted hub shows every site's status on one dashboard.
- Adding a site takes two steps: Add site on the hub gives you a site ID and secret; paste them into Hub link on the collector.
- Collectors connect out over HTTPS only. No inbound firewall ports at any site.
- Sites that stop reporting are flagged as stale.
- Sign in with Microsoft or Google work accounts.
- Owner, admin and viewer roles, with approval for new users.
Security & privacy
Only status leaves the site. Read the security overview.
- The hub receives sensor names, device labels, status and latest values, with IP addresses redacted from status messages.
- IP addresses, hostnames, monitored URLs, SNMP community strings and history stay on the collector.
- Pushes are signed with HMAC-SHA256, with timestamp and nonce replay protection.
- New collectors require two-factor sign-in for admins; for everyone else it's optional.
Appliance
The collector is a virtual appliance that runs at each site and works fully on its own.
- Images for VMware and VirtualBox (OVA), Hyper-V (VHDX) and Proxmox / KVM (qcow2).
- Its own web dashboard at
https://<vm-ip>/, with history kept in SQLite for 30 days by default. - No restarts: configuration changes apply live, and the configuration is backed up on every change.
- Monitoring, history and the local dashboard keep running if the internet link drops.
- The version is in the header, and admins see Update available when a newer release is out. The daily check is a plain download that sends nothing about the collector or its network, and nothing is installed by itself.
Users, roles & access
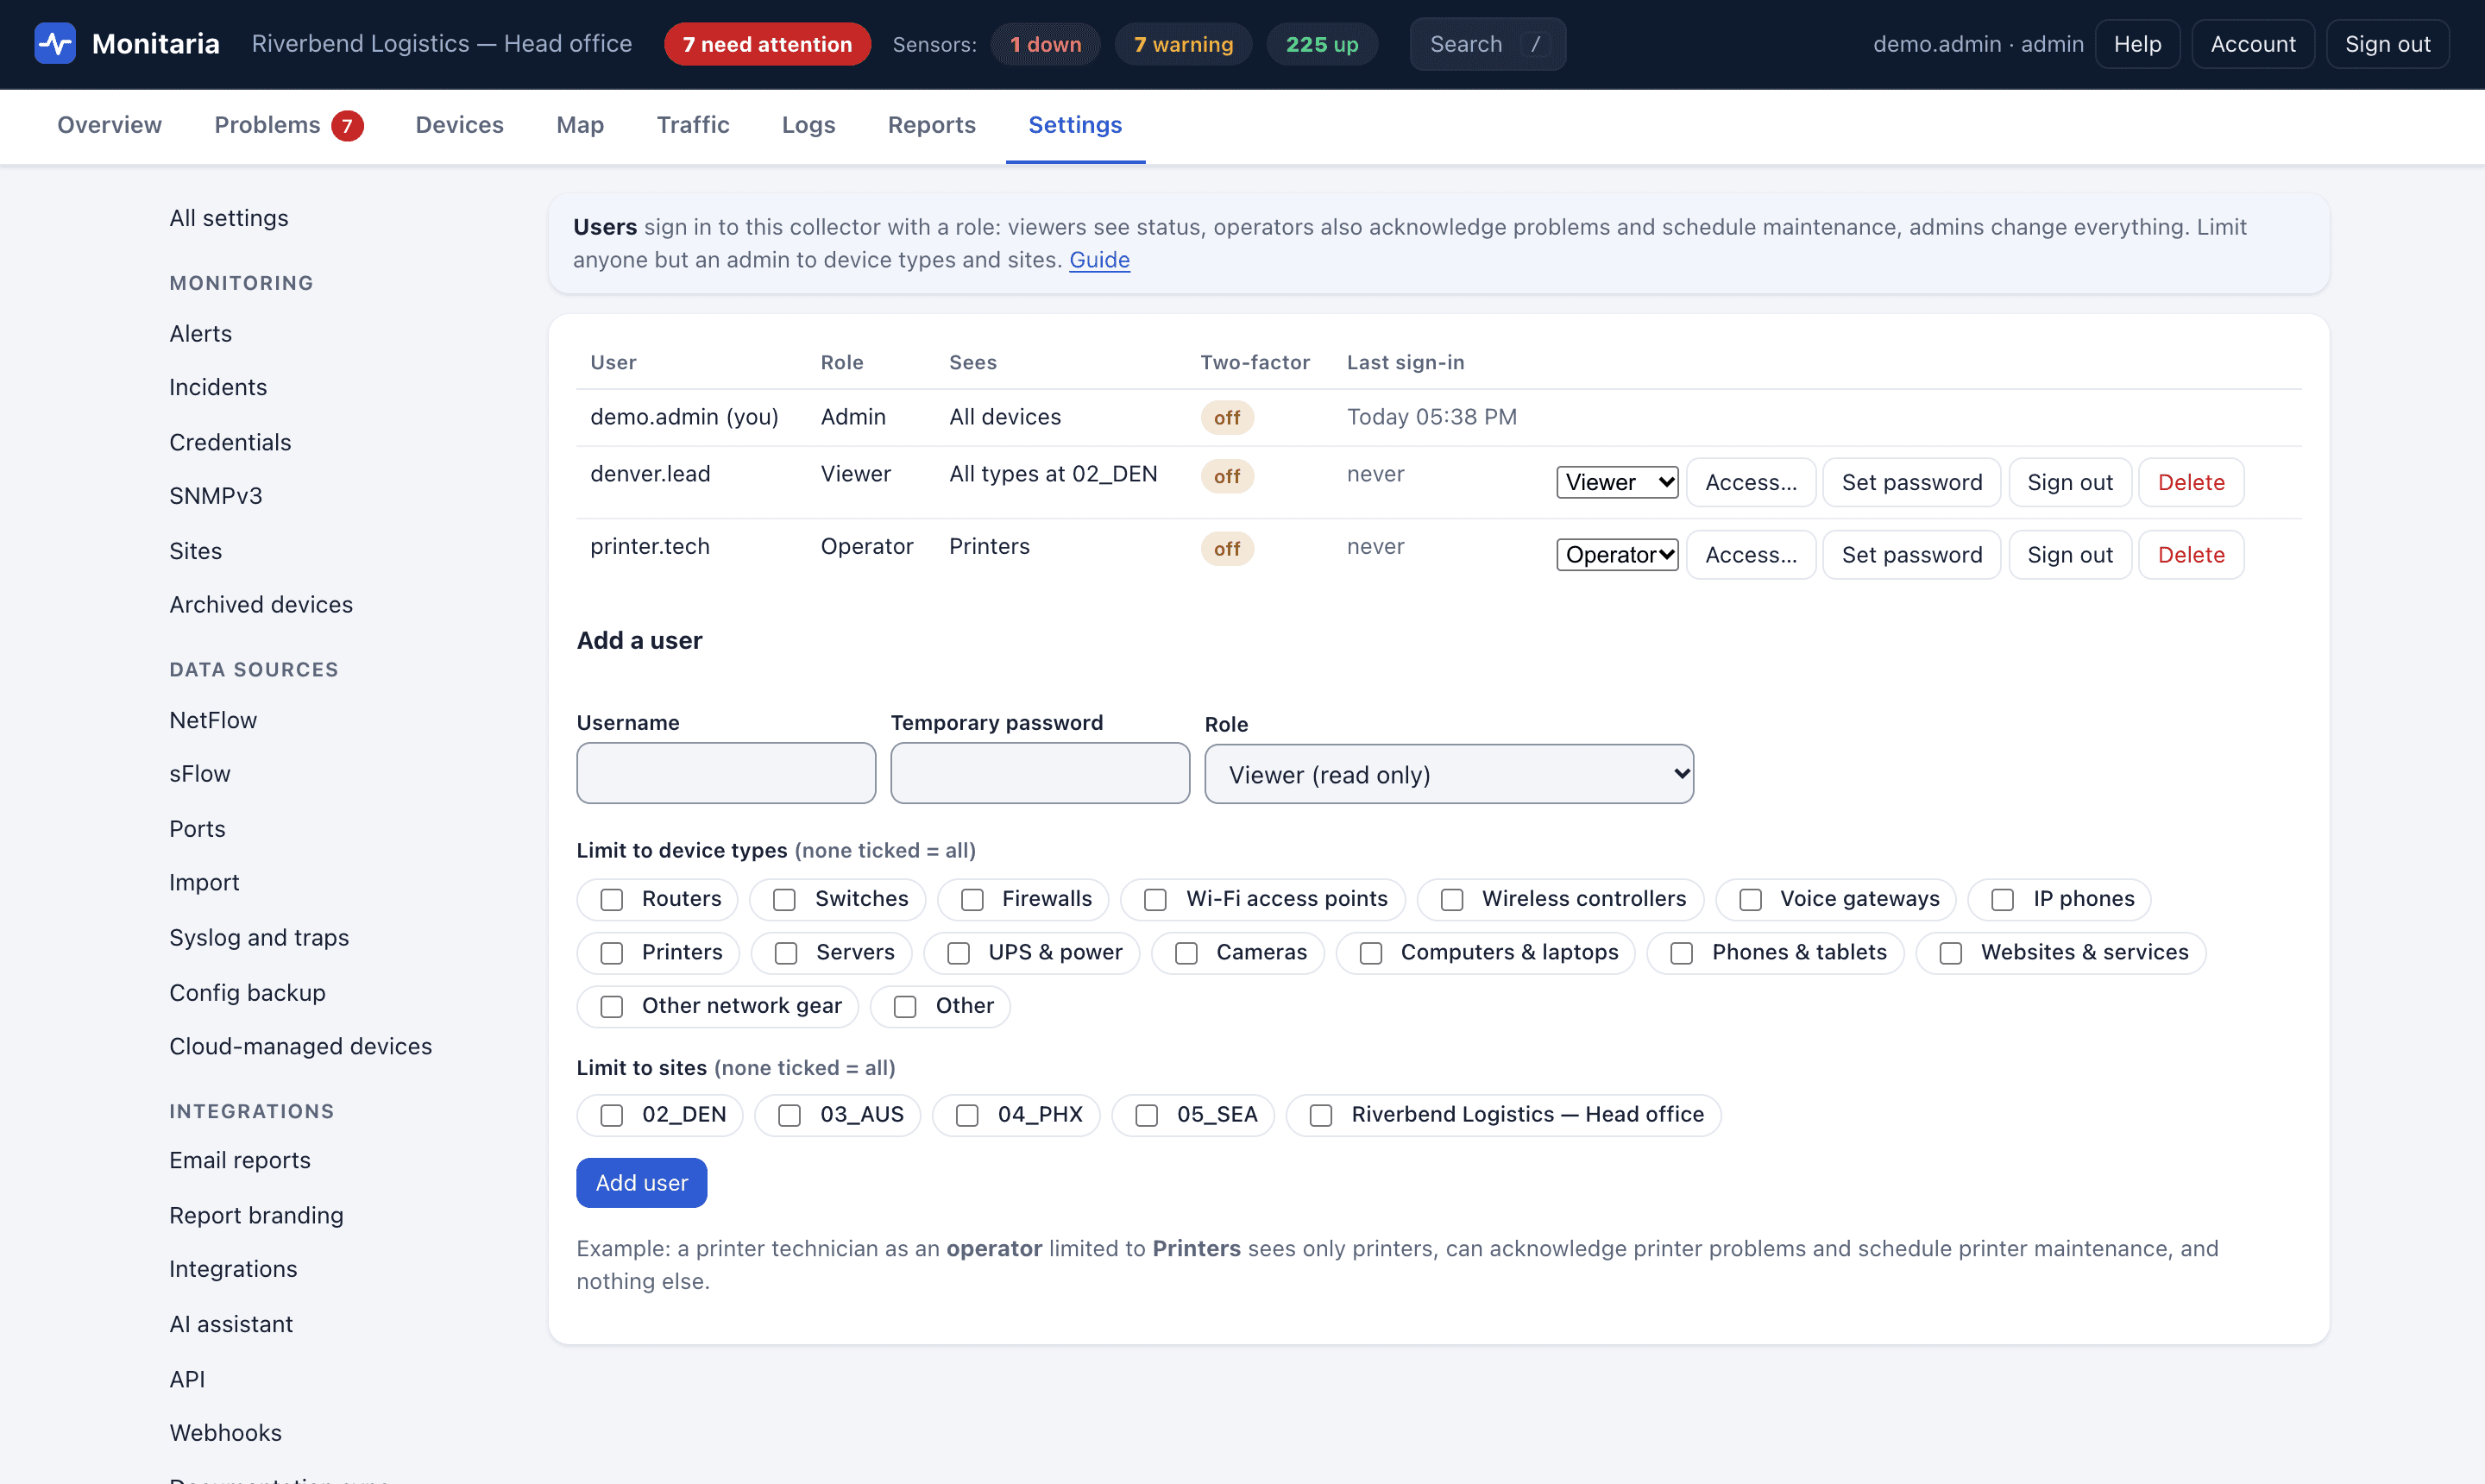
Give each person exactly the devices they look after, enforced on the server, not just hidden in the page.
- Roles: admin (everything), operator (acknowledge and schedule maintenance), viewer (read only).
- Scopes: limit operators and viewers by device type and site, such as printers only, or one branch.
- Scopes apply to status, history, events, dashboards, reports and API tokens alike.
- The hub has the same per-user access for viewers, by site and device type.
- New collectors require two-factor sign-in (an authenticator app) for admins, who set it up at their first sign-in. A collector upgraded from an earlier version keeps the setting it had. For everyone else it's optional, unless an admin requires it for everyone in Settings › Security. Single sign-on accounts use your identity provider's second step instead. Idle sessions sign out.
- See every signed-in session and end any of them; users can end their own.
- Audit log of sign-ins, failed attempts and every change, with CSV export, on the collector and the hub.
Alerts, maintenance & acknowledgements
Every alert should mean someone needs to look now.
- Alert rules: route by device type, site and status to email (SMTP, including Microsoft 365 and Google Workspace) or webhooks (Teams, Slack and anything that takes JSON).
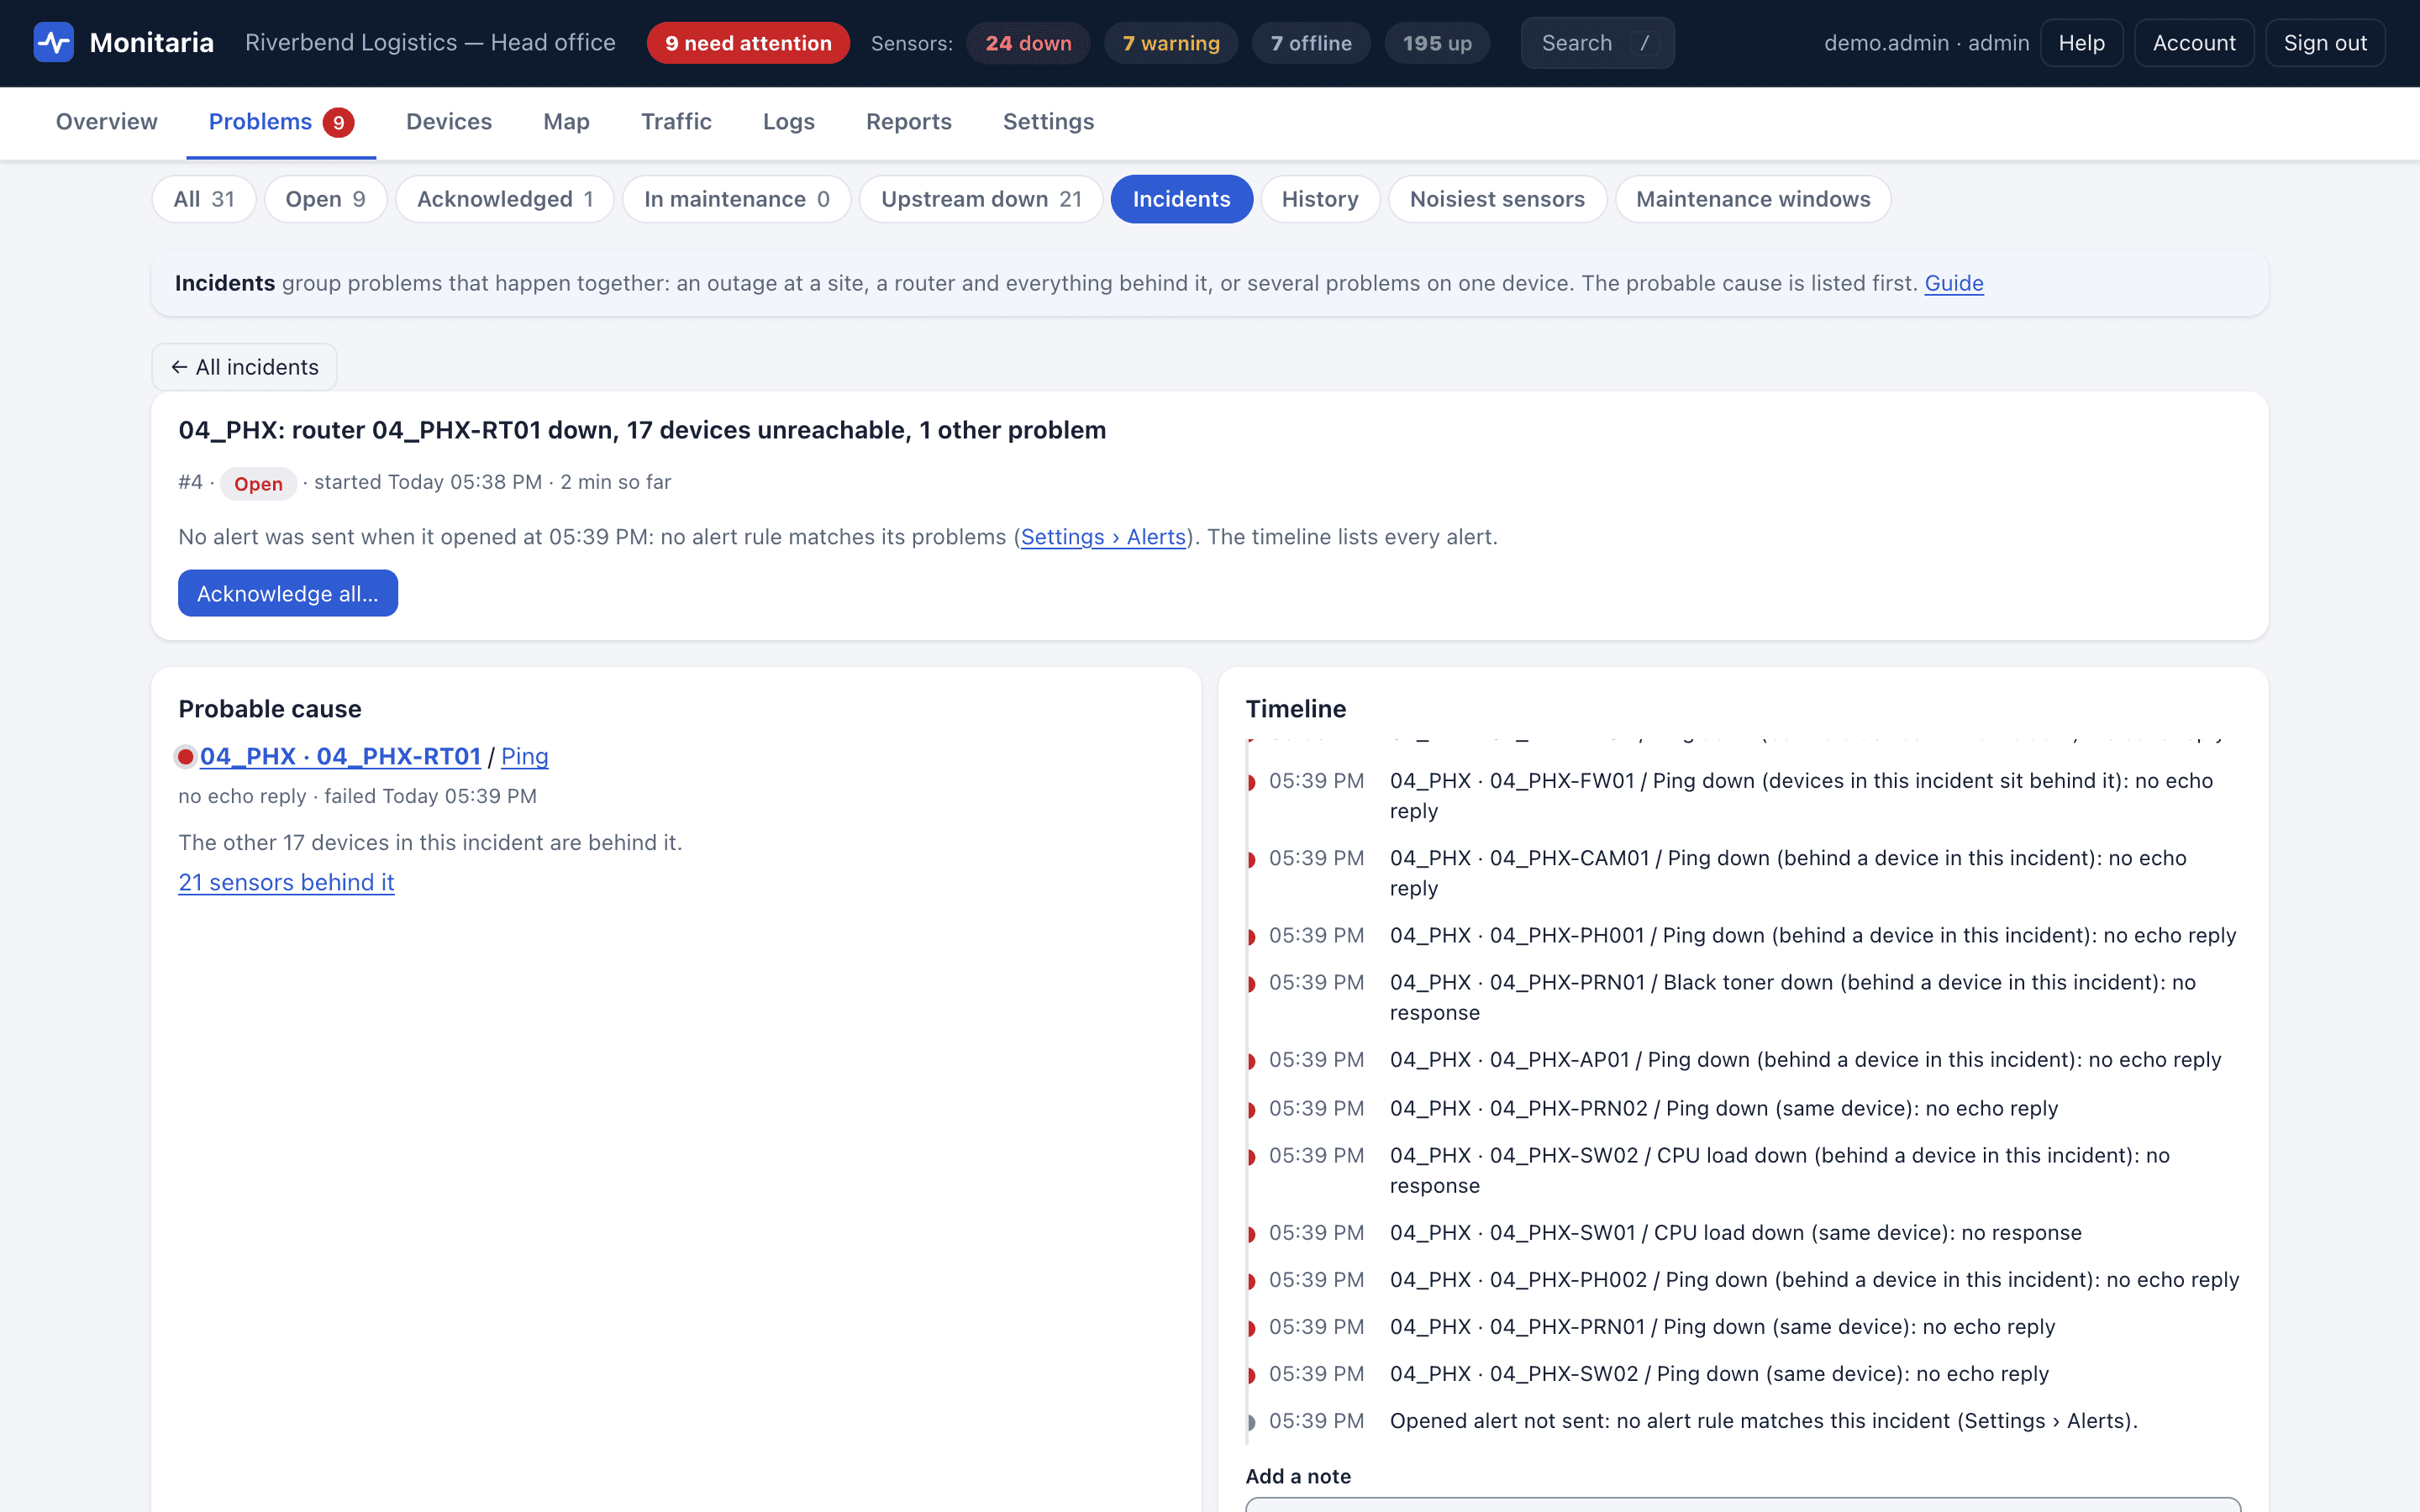
- Dependencies: devices at a remote site depend on its router and firewall automatically, so a WAN outage raises one alert. Set your own with Depends on.
- Maintenance windows: by device type, site or device, scheduled ahead or started now. No alerts, no health penalty.
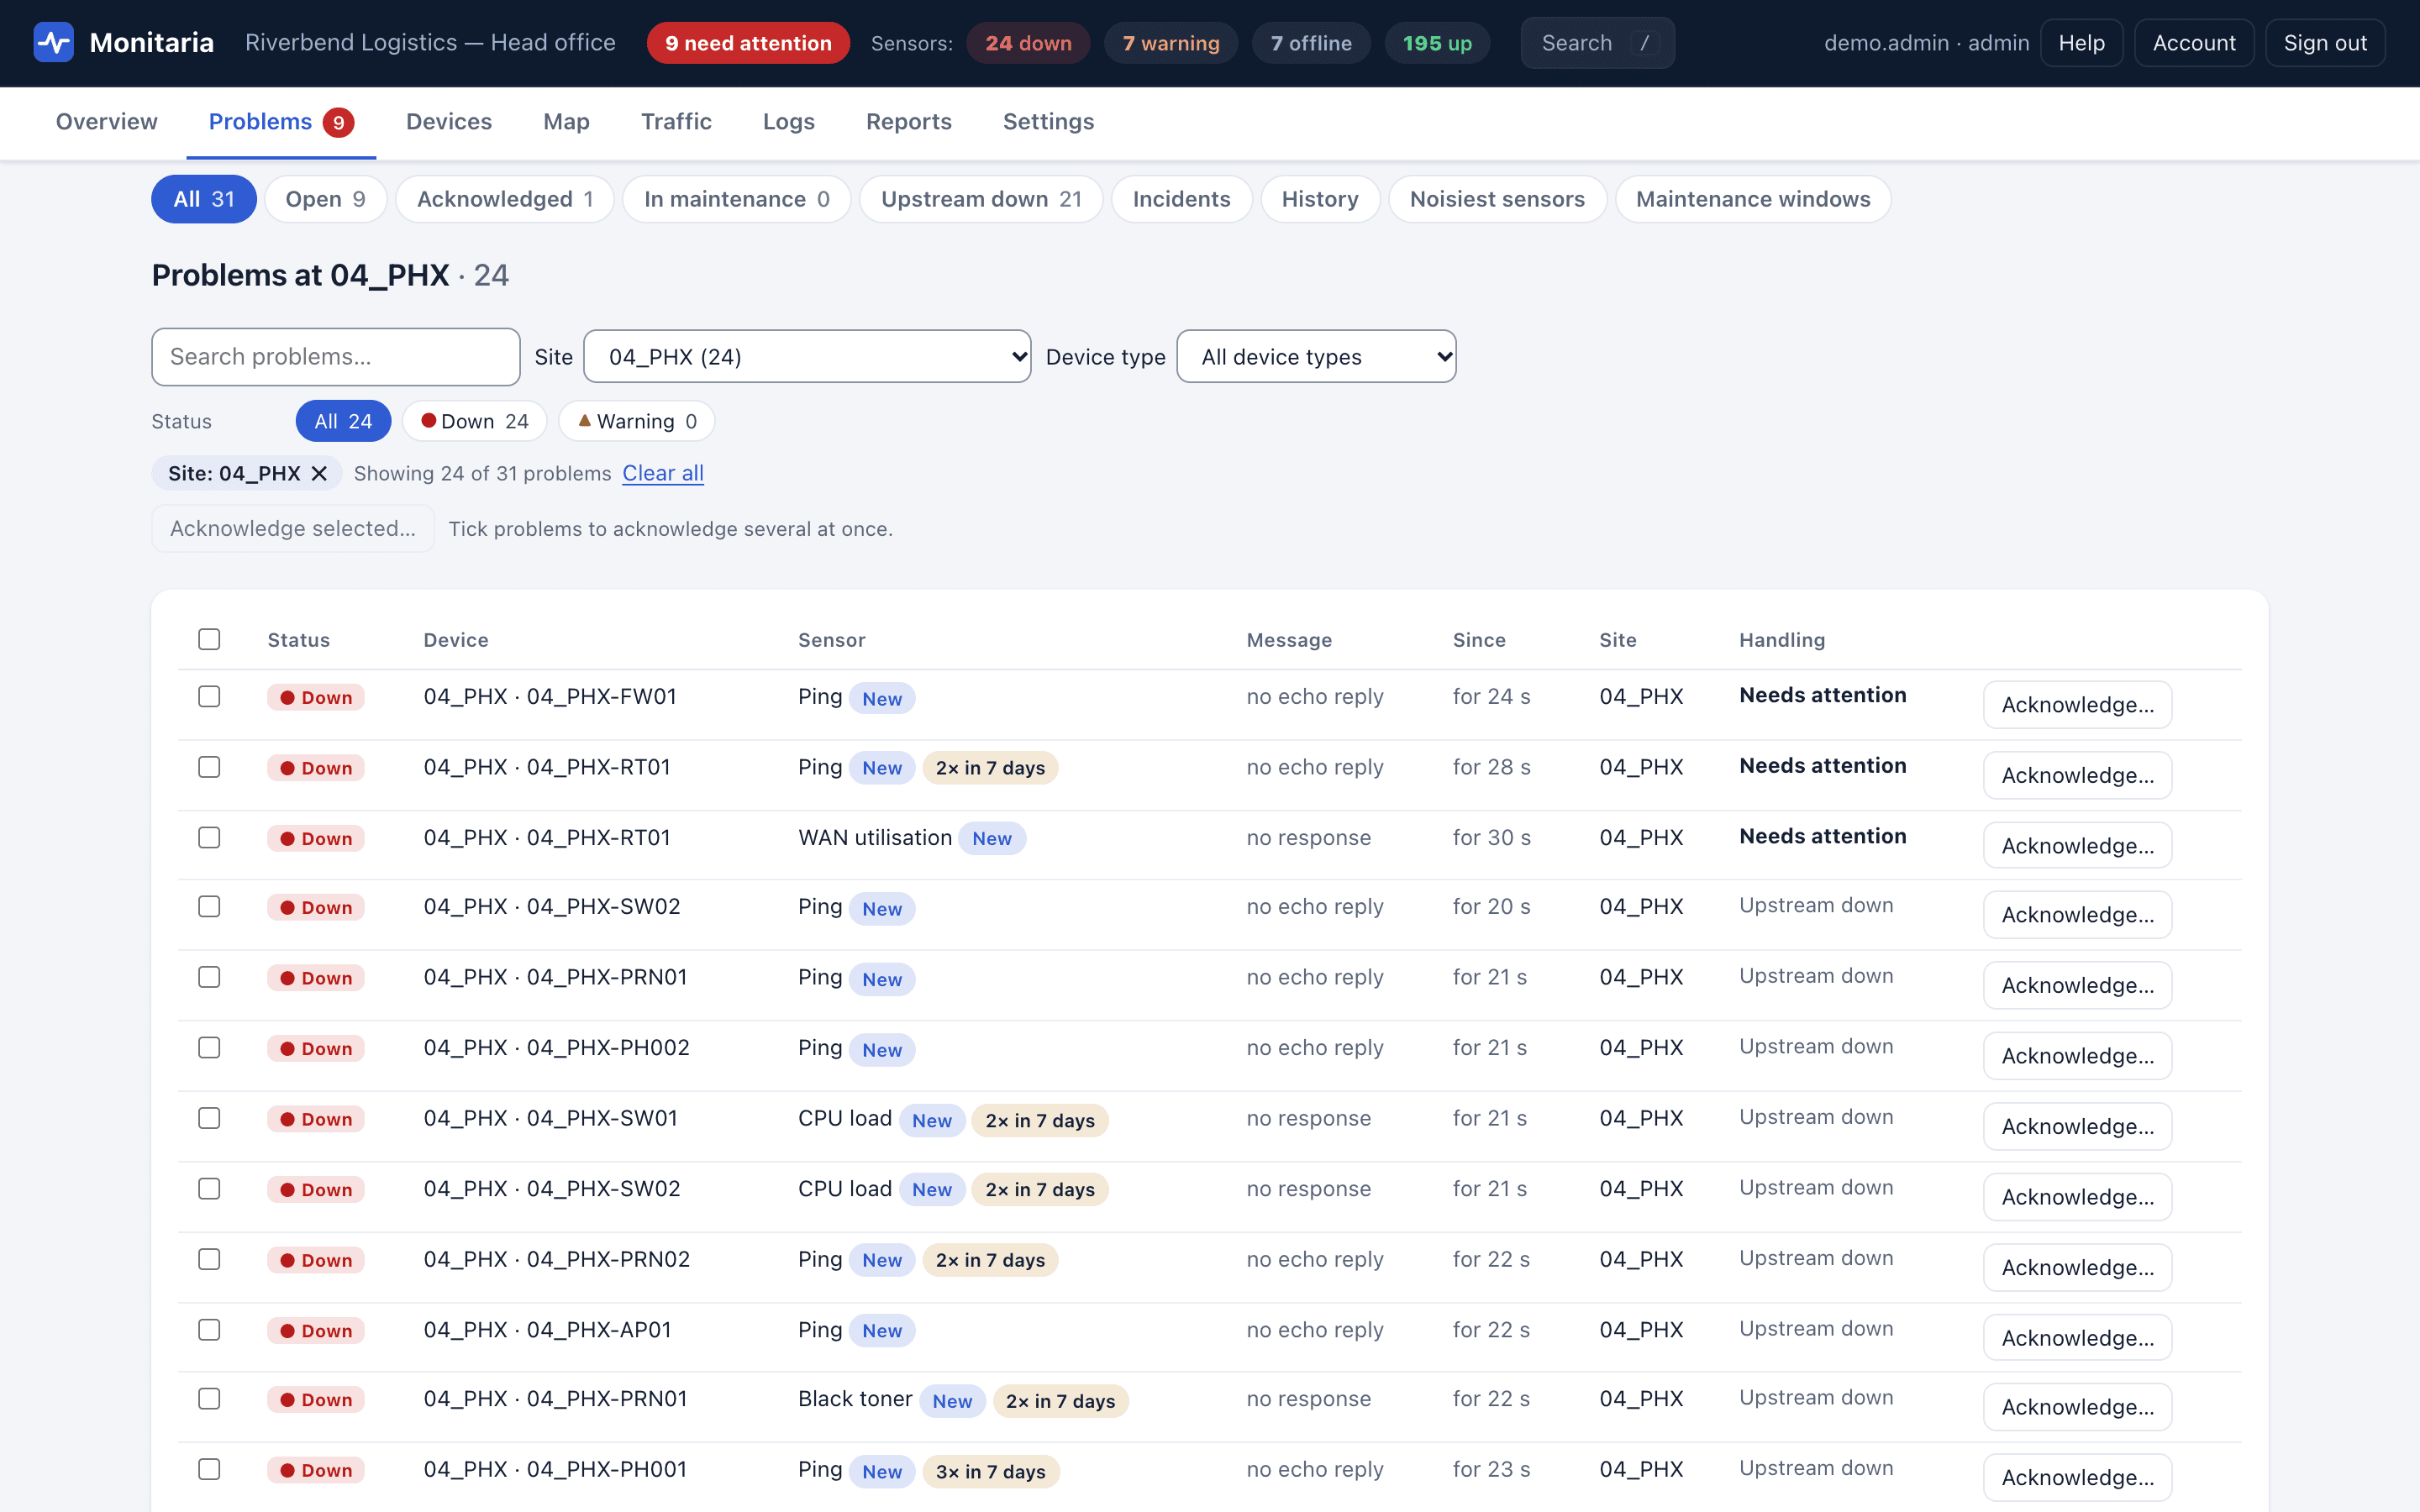
- Acknowledgements: with a note; they sort below new problems and clear themselves on recovery.
- Escalation: repeat an alert while the problem stays down and unacknowledged.
- Incidents: problems that happen together are grouped with the probable cause first, optionally with one alert per incident; Noisiest sensors lists the sensors that alert most, with a suggestion for each.
- Test delivery from the settings page and see recent deliveries and failures.
Traffic, map and logs
What the network is doing, from data that never leaves the collector.
- Traffic: NetFlow v5/v9, IPFIX and sFlow v5: top talkers, applications, conversations and interfaces, traffic per site, and unusual traffic against each host's own baseline.
- Ports: every switch and router port over SNMP, with utilisation and the 95th percentile, errors, discards and unused ports.
- Map: sites around the WAN with router latency, jitter and link load, links from CDP/LLDP, and a view of each site.
- Logs: syslog and SNMP traps tied to their devices, with rules that turn the messages that matter into problems.
- Config backup: router, switch and firewall configurations read over SSH, every version kept, with what changed.
Integrations and import
Monitaria fits next to the tools you already use. Each integration is off until an admin turns it on.
- PSA tickets in ConnectWise PSA, Autotask, HaloPSA, ServiceNow and Jira Cloud, and PagerDuty paging, with acknowledgements both ways.
- Documentation sync: one IT Glue configuration or Hudu asset per monitored device, kept up to date.
- Cisco Meraki, Ubiquiti UniFi, Fortinet FortiGate and HPE Aruba Central devices through their own APIs.
- Signed event webhooks with retries, and a versioned OpenAPI 3.1 reference.
- Import devices, sensors and groups from your current monitoring tool's export, previewed before anything is created.
- Explain this: built-in rules explain a problem with the evidence, optionally with an AI explanation, and a read-only MCP server.
Reports & API
Numbers for customer reviews, management and other systems.
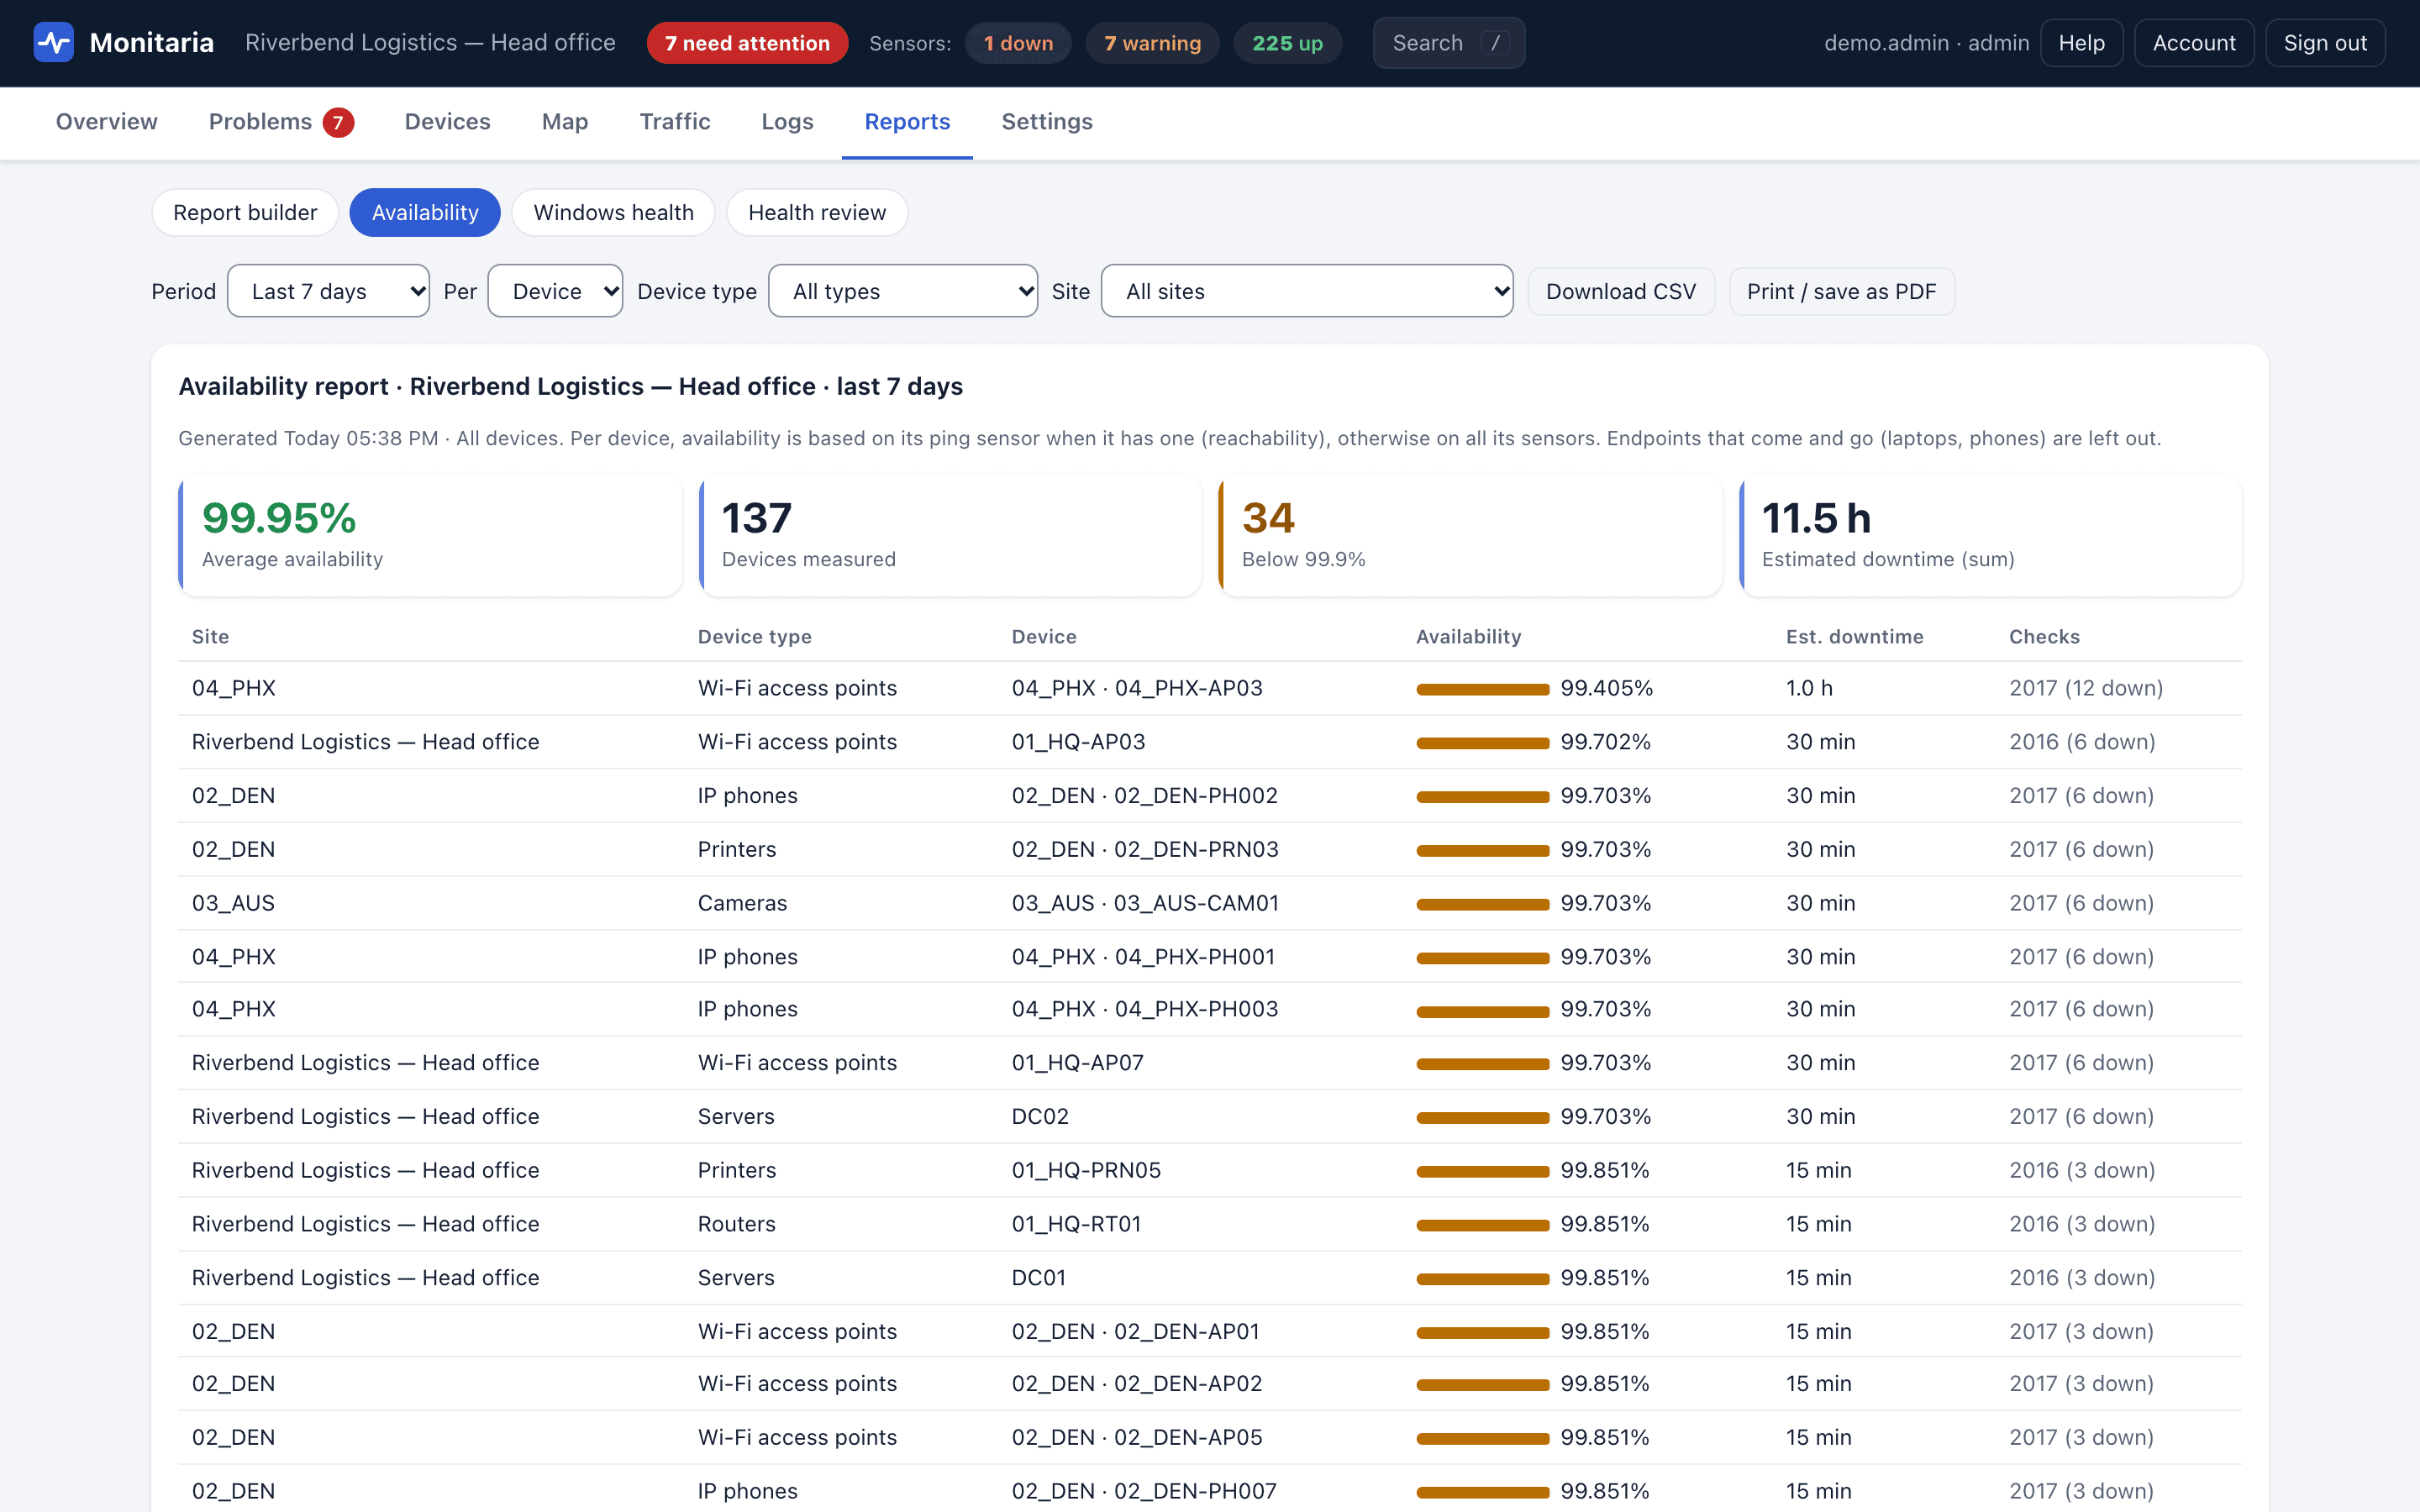
- Availability per device or per sensor for 24 hours, 7, 30 or 90 days, with estimated downtime.
- The report builder: saved reports from sections, with your branding and each customer's, previewed, printed, downloaded as HTML or CSV, or emailed every day, week or month.
- Filter by device type and site; print to PDF or download CSV.
- Read-only API tokens with a scope and an expiry, for PSA, wallboards and scripts.
- Status, events, availability and reports as JSON (and CSV for reports).
Try it on your own network
Every collector includes a 30-day evaluation with every feature, counted from the first time it starts. Monitoring and alerts never stop because of licensing.