Retail
Every store's network, watched from one place
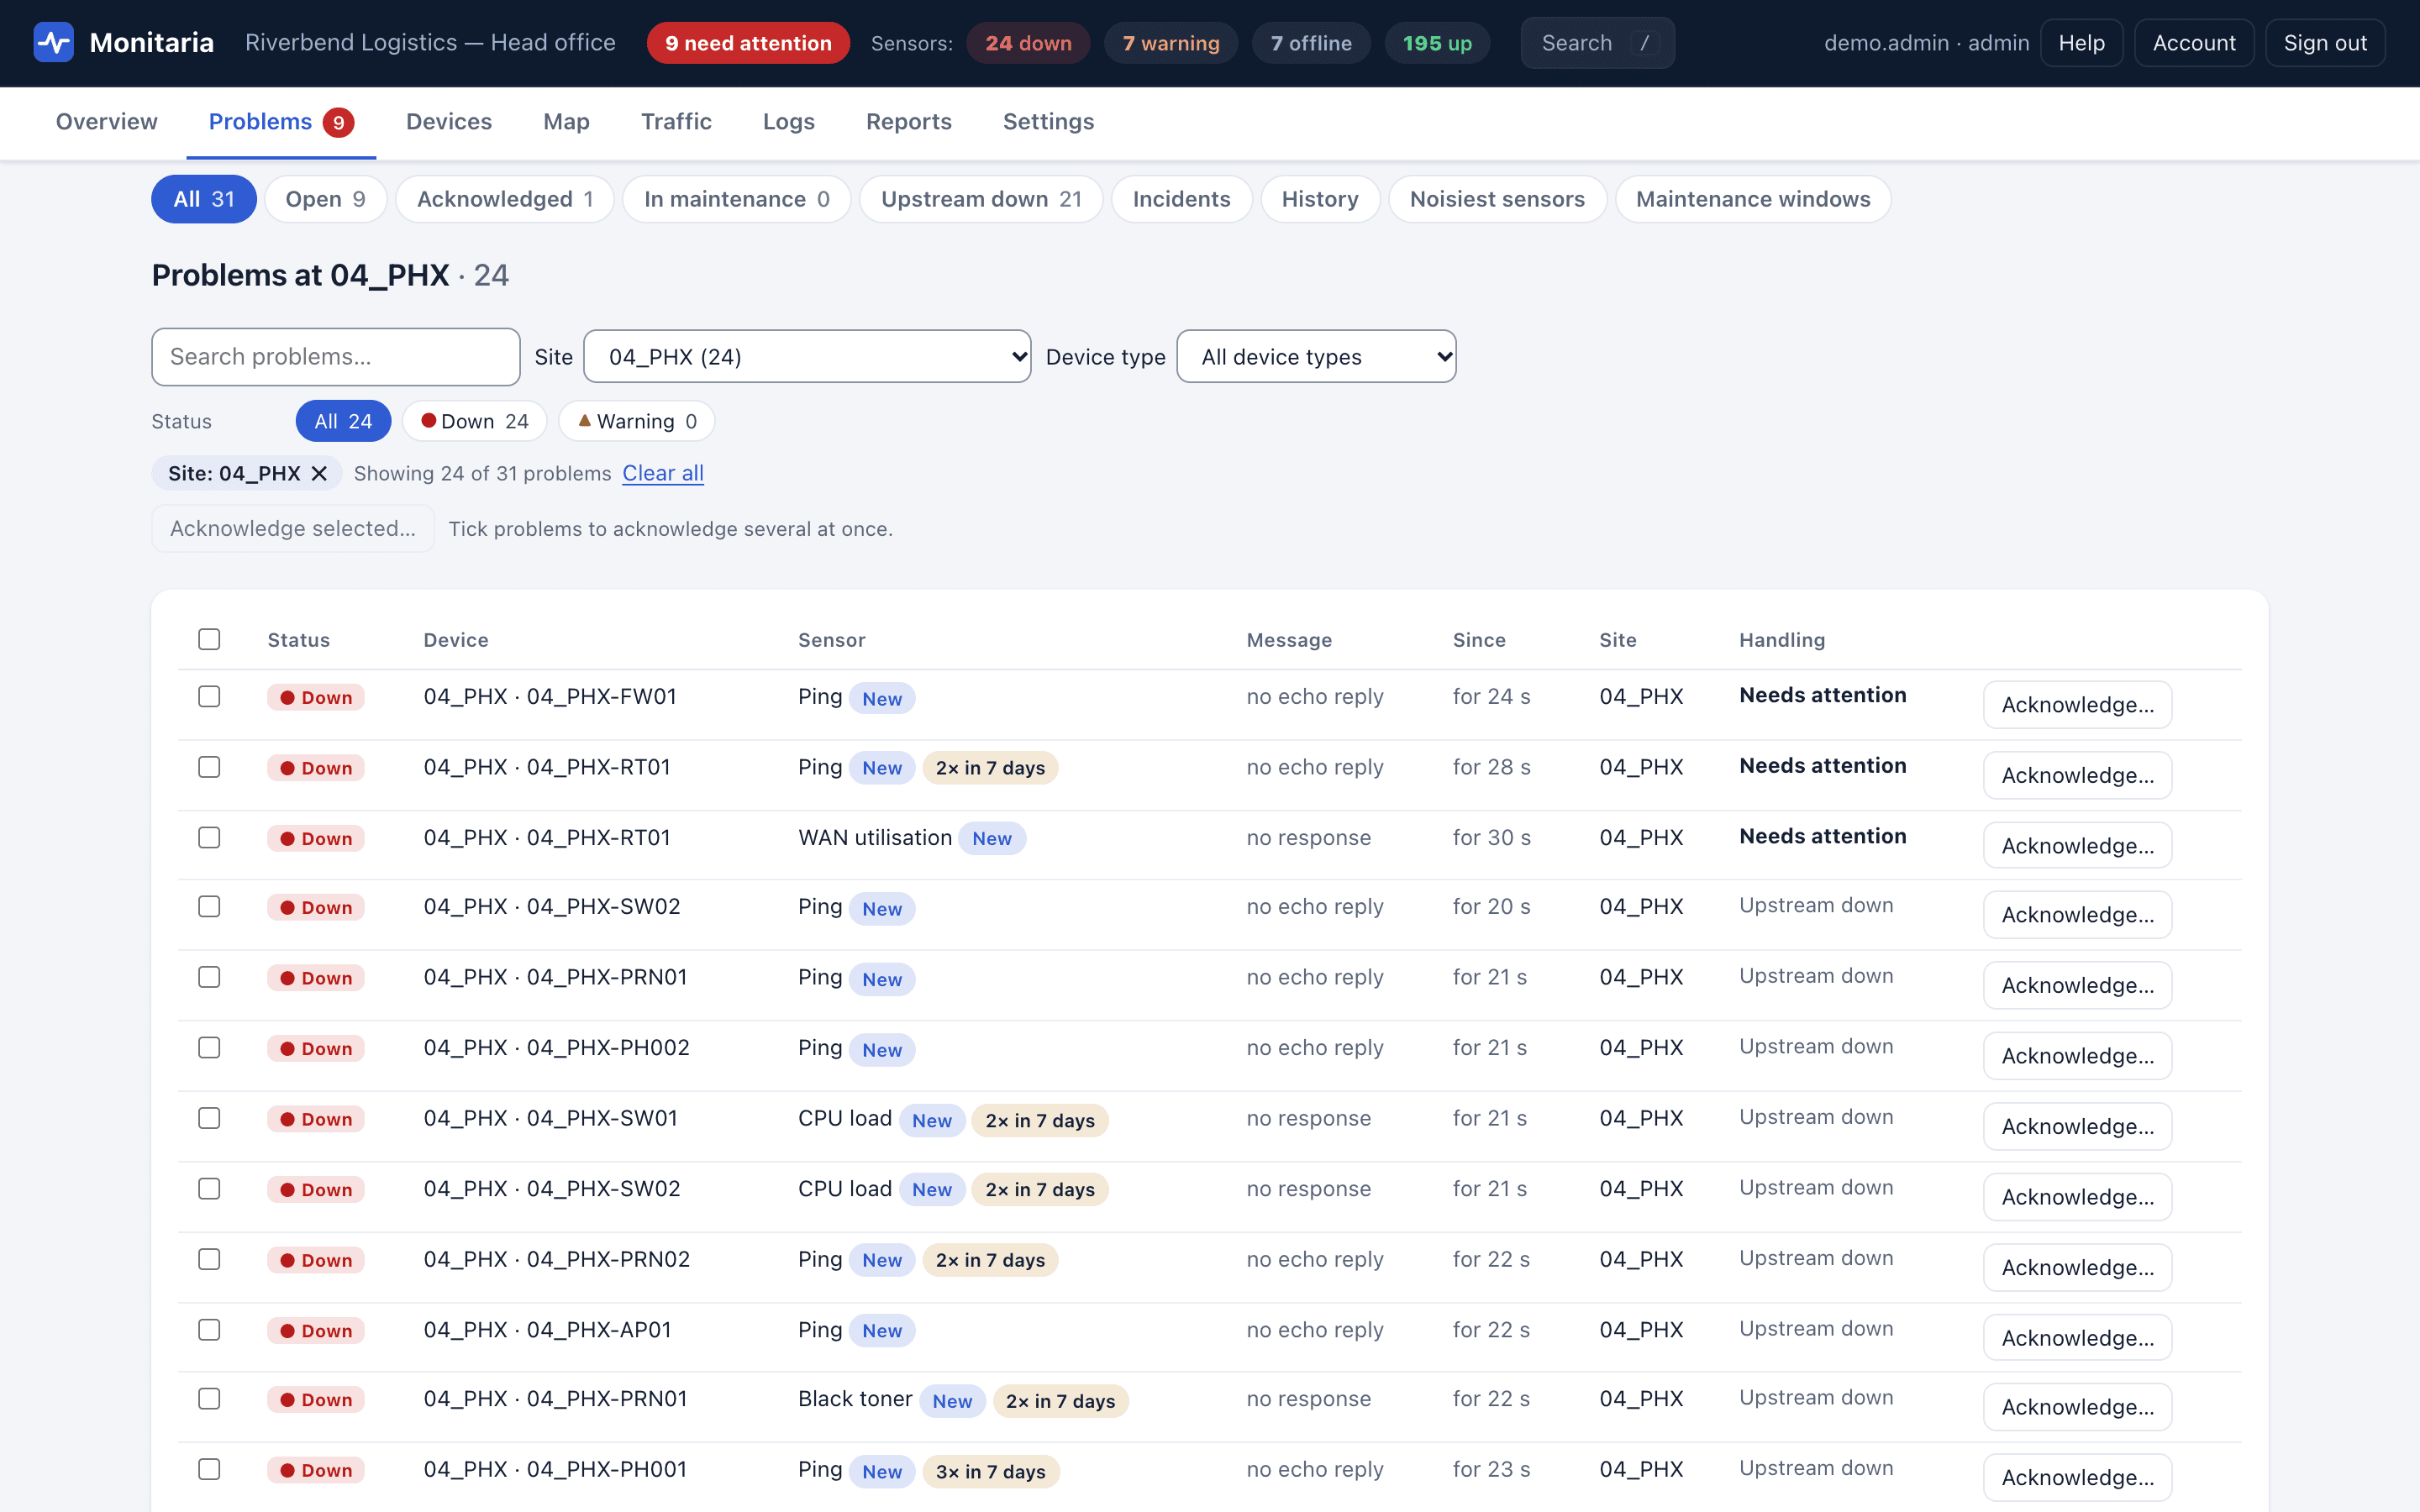
A store has a router or firewall, a few switches and access points, printers and back-office computers, and usually nobody technical on site. Monitaria watches them and tells you which store needs attention, and why.
What it handles
- A store goes dark
- Devices at a store depend on its router and firewall automatically. When the store's link drops you get the router's problem; the devices behind it wait as Upstream down, and the map marks the store unreachable.
- Rolling out to many stores
- One collector can read each store router's VLANs over SNMP and scan them across the WAN, or each store can run its own collector linked to the hub. Device name prefixes or the networks in Settings › Sites place every device in its store.
- Cloud-managed gear at the stores
- Cisco Meraki, Ubiquiti UniFi, Fortinet FortiGate and HPE Aruba Central devices are read through the vendors' own APIs and monitored next to everything else, with the same sites, alerts and reports.
- WAN circuits that are always full
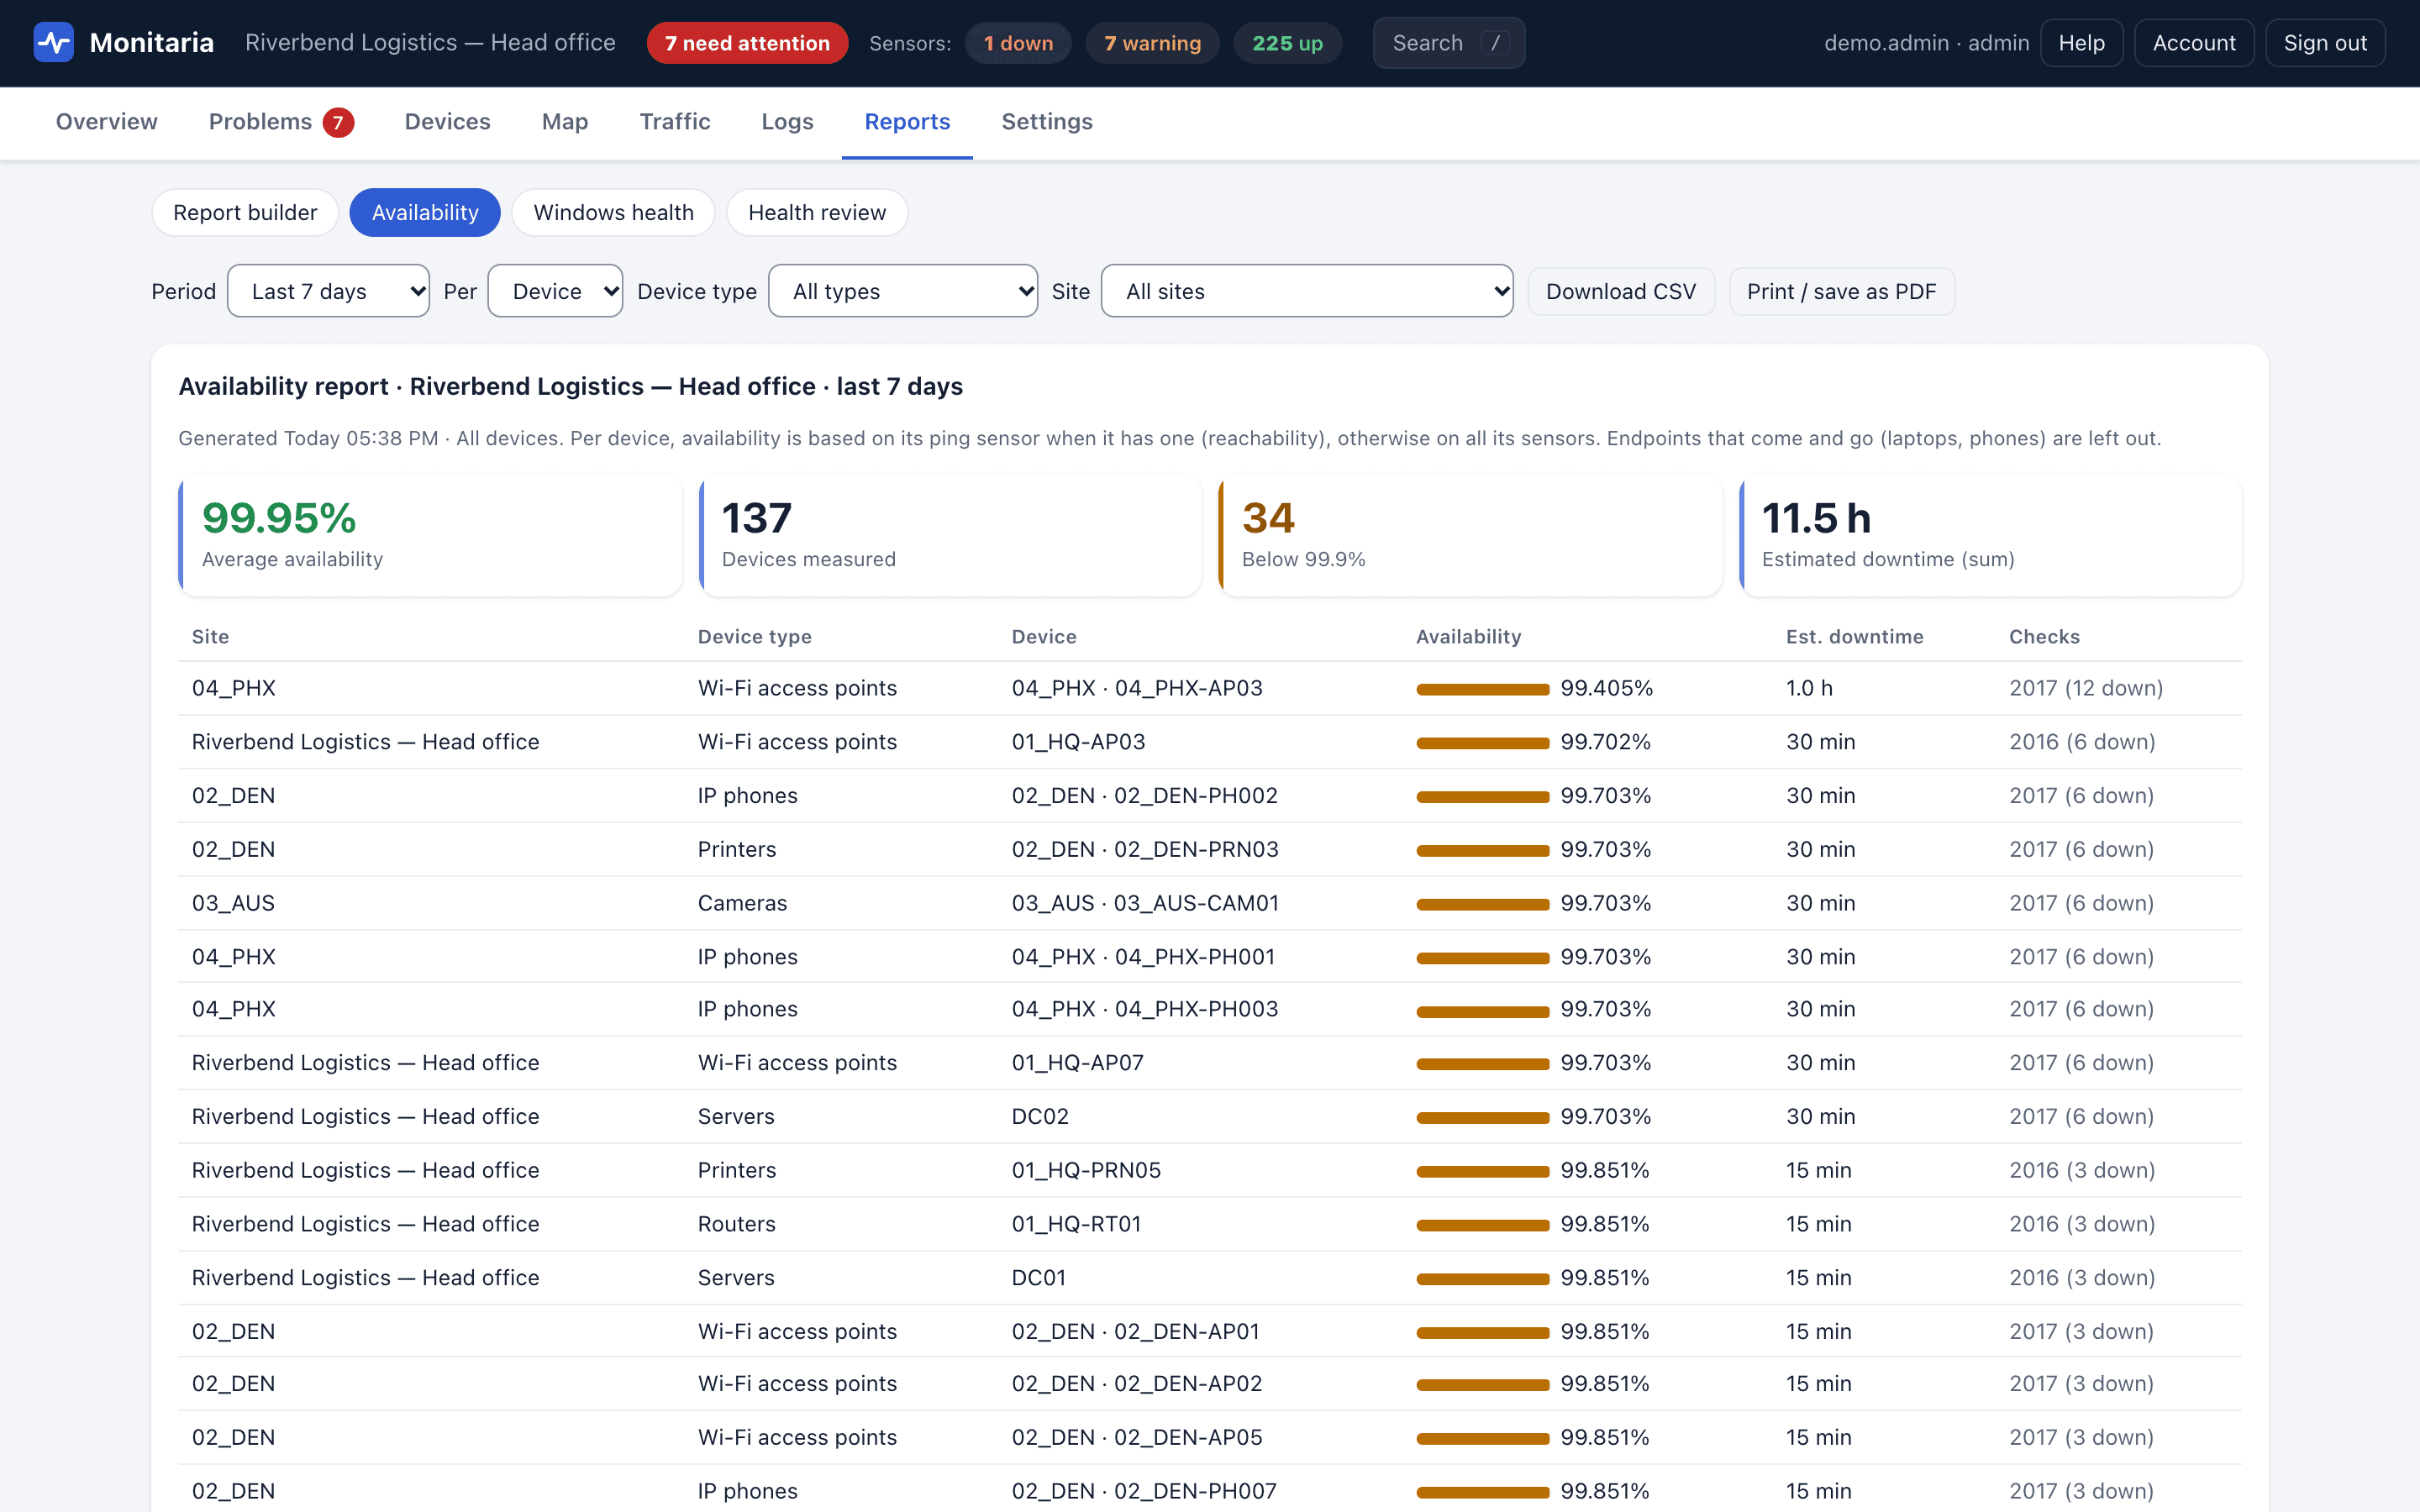
- Set each store's circuit speeds: the map's link load and WAN warnings use them, and the health review flags busy circuits.
- Regional managers want their stores
- Viewers limited to a few sites see only those stores, in every list, dashboard and report.
What it looks like
How it connects
Customer network, at each site
- Routers and firewalls
- Switches and Wi-Fi
- Servers and UPS
- Printers, phones, cameras
- Computers and laptops
- Websites and services
Ping, TCP, HTTP(S), DNS, TLS, SNMP v1/v2c/v3, WinRM; NetFlow, sFlow, syslog and traps in
Local collector VM
- Checks every device and keeps the history in SQLite on the VM
- Raises alerts and serves its own dashboard on the local network
- Keeps monitoring when the internet link is down
Site firewall
Outbound HTTPS only
TCP 443 to the hub. A small status snapshot, signed with HMAC-SHA256, with replay protection.
Inbound: nothing
No firewall rules, no VPN, no port forwarding.
Hosted
Monitaria hub
- Every site's status on one dashboard
- Sign-in with Microsoft or Google work accounts
- Flags sites that stop reporting
- Only answers; never connects to a site
Optional: a collector also runs on its own, with no hub.
Also included
- Alerts routed by site and device type to email or webhooks (Teams, Slack)
- Maintenance windows for store refits and ISP work
- Availability reports to print, save as PDF or download as CSV
- Per-device pricing; sites are unlimited
Try it on your own network
Every collector includes a 30-day evaluation with every feature, counted from the first time it starts. Monitoring and alerts never stop because of licensing.