For multi-site IT teams
One view of every location your team looks after
Clinics, schools, stores, offices and warehouses: Monitaria watches the routers, switches, access points, phones, printers, servers and cameras at every location and puts them on one dashboard.
Run one collector at head office that reaches every location across the WAN, or a collector at each location linked to the hub. Either way, nothing on the internet connects in.
What it handles
- Is it the branch, or the WAN?
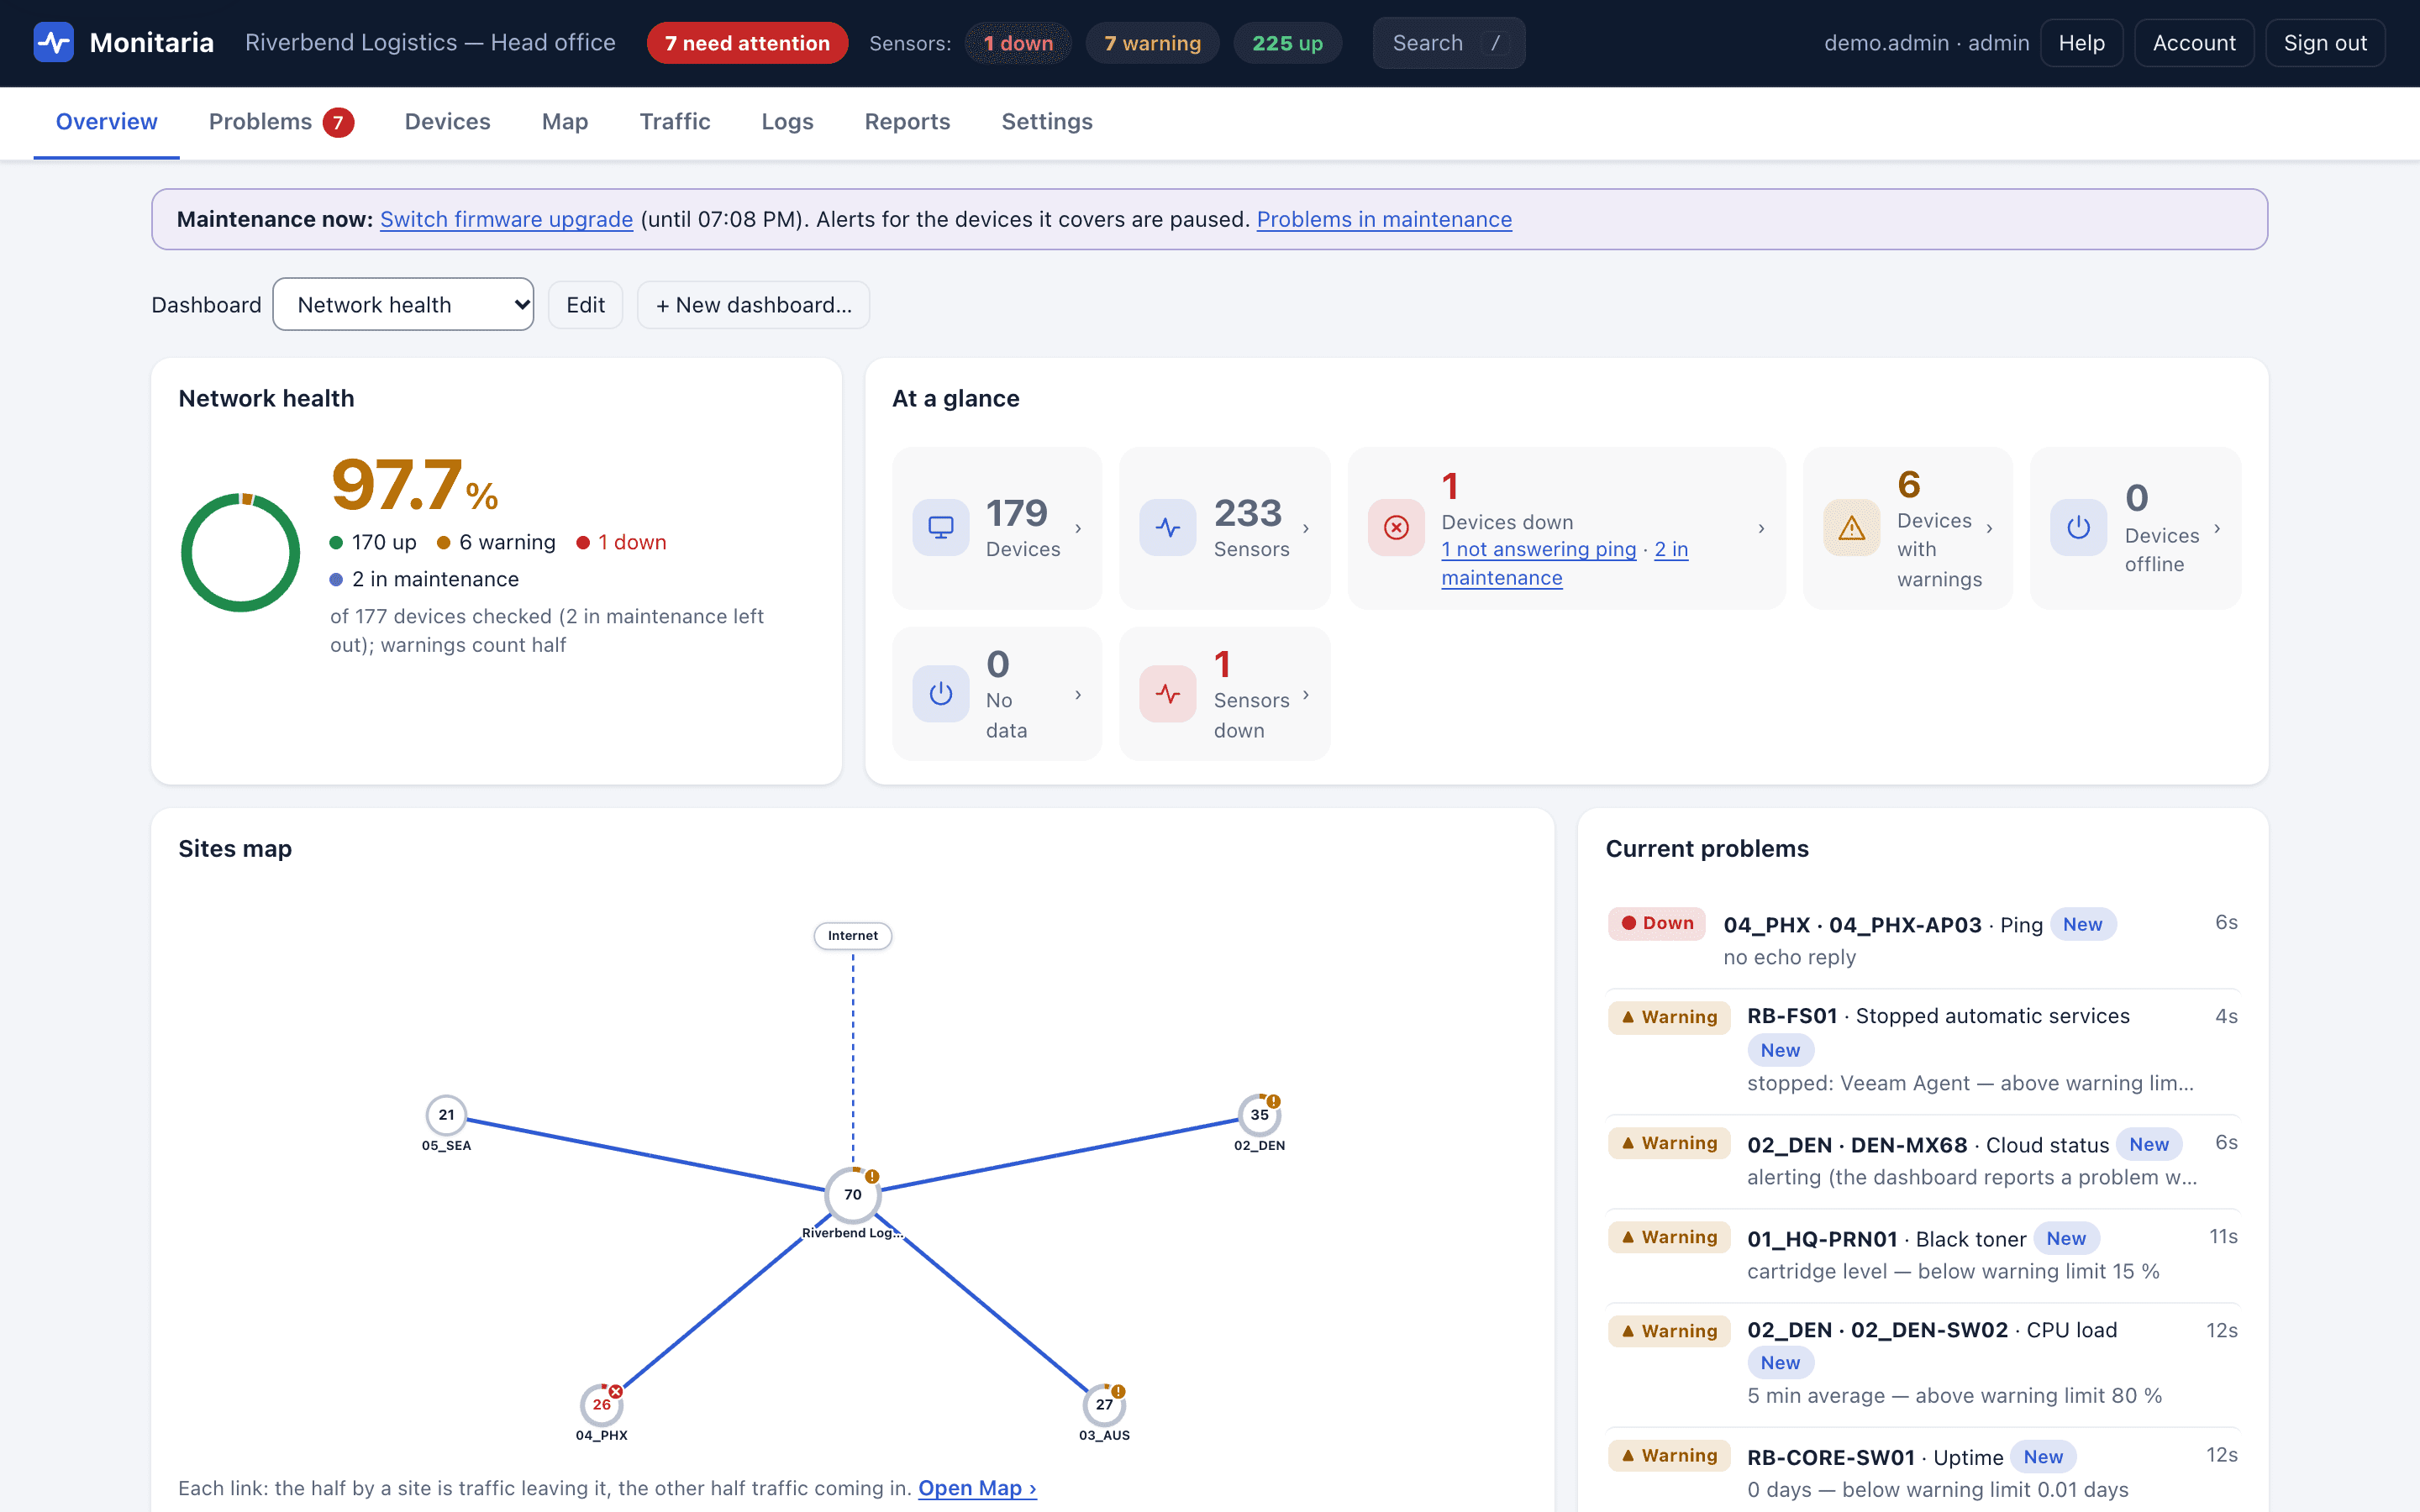
- The map shows every site around the WAN with router latency, jitter and link load, and marks a site unreachable when every router there is down. Devices behind a down router wait as Upstream down, so the cause is the first thing you see.
- Reaching every location from one place
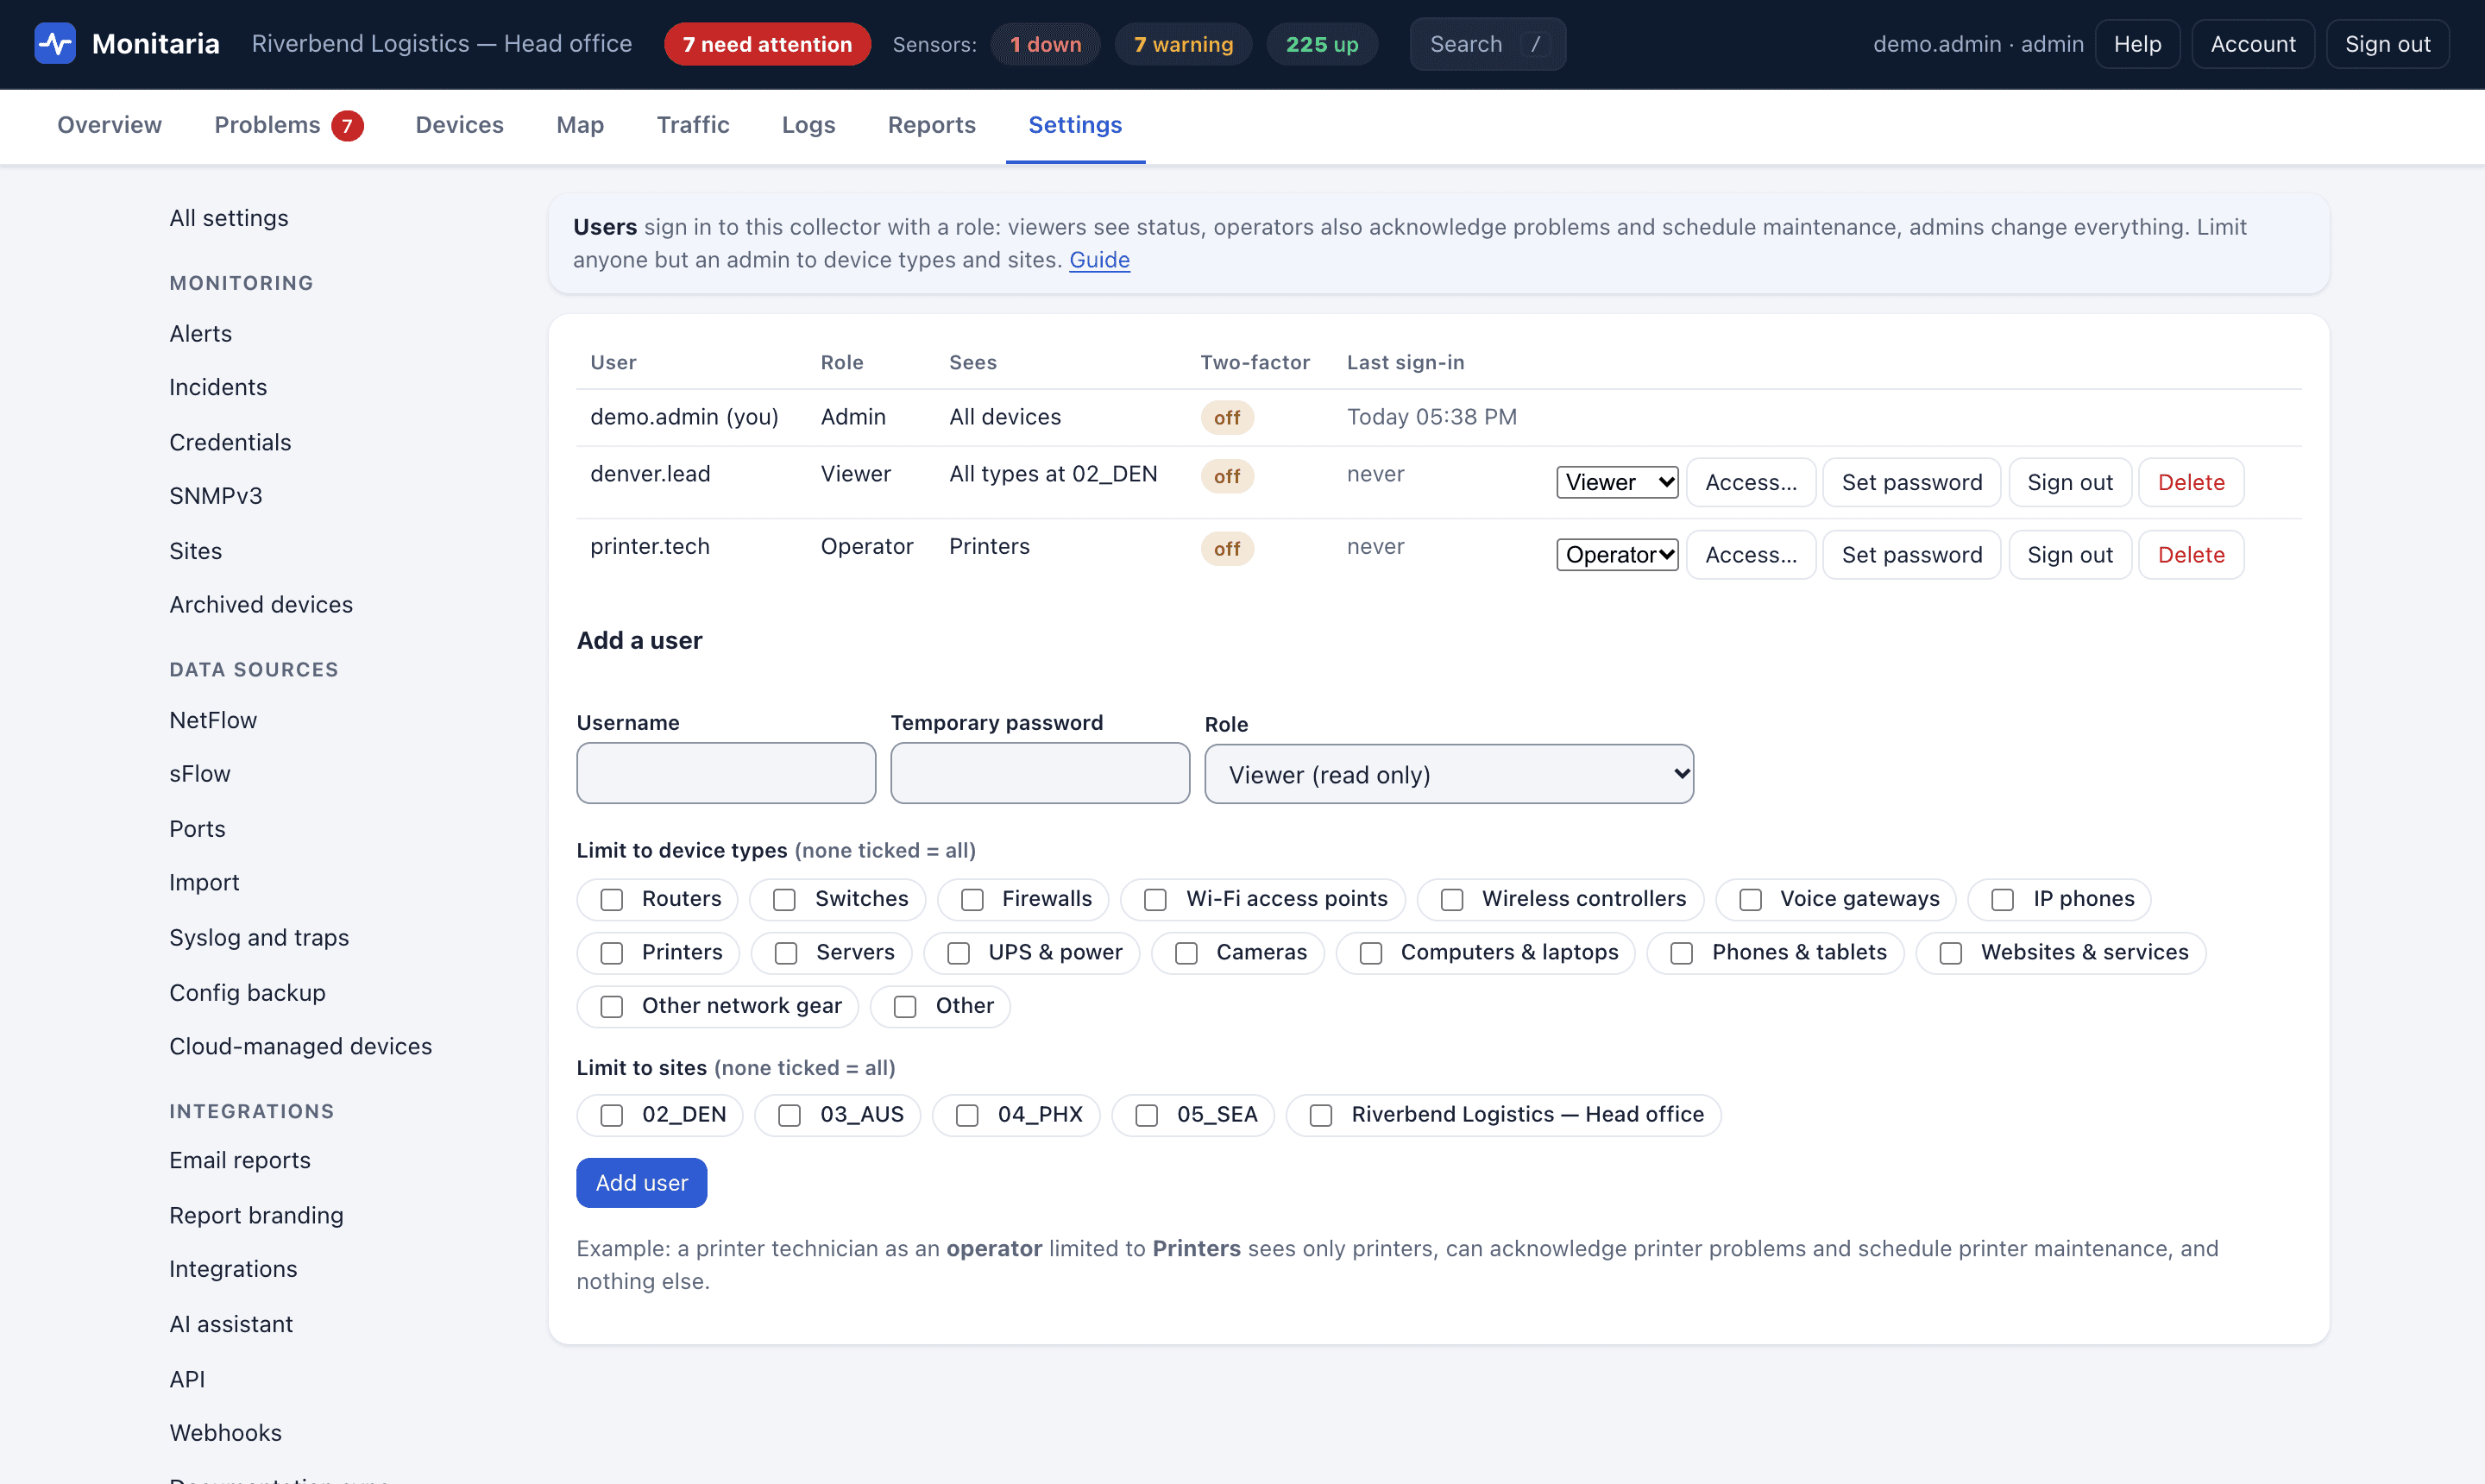
- Devices › Discovery › Other sites reads each site router's VLANs over SNMP and scans them across the WAN. Settings › Sites gives every network its site, so views, alert rules, maintenance windows and access all follow it.
- Site leads need their site, not everything
- A viewer or operator can be limited to one site or a few, and to device types. They see only those devices, everywhere: lists, dashboards, reports and the API.
- Management wants one number
- Every dashboard starts with a health score: the share of devices that are fully up, with warnings counting half. The Executive summary dashboard adds availability over 24 hours and 7 days and the sites.
- The monitoring must not be a single point of failure
- Two collectors can run as a high availability pair: the standby takes over monitoring, receiving and alerting in about 30 seconds when the primary stops, then hands back.
- Sign-in should follow your identity provider
- Collectors can use single sign-on with OpenID Connect or SAML 2.0, with SCIM 2.0 to add and remove accounts. The hub signs people in with Microsoft or Google work accounts.
What it looks like
How it connects
Customer network, at each site
- Routers and firewalls
- Switches and Wi-Fi
- Servers and UPS
- Printers, phones, cameras
- Computers and laptops
- Websites and services
Ping, TCP, HTTP(S), DNS, TLS, SNMP v1/v2c/v3, WinRM; NetFlow, sFlow, syslog and traps in
Local collector VM
- Checks every device and keeps the history in SQLite on the VM
- Raises alerts and serves its own dashboard on the local network
- Keeps monitoring when the internet link is down
Site firewall
Outbound HTTPS only
TCP 443 to the hub. A small status snapshot, signed with HMAC-SHA256, with replay protection.
Inbound: nothing
No firewall rules, no VPN, no port forwarding.
Hosted
Monitaria hub
- Every site's status on one dashboard
- Sign-in with Microsoft or Google work accounts
- Flags sites that stop reporting
- Only answers; never connects to a site
Optional: a collector also runs on its own, with no hub.
Also included
- Per-device pricing; sites are unlimited
- Alerts by email and webhook, routed by device type, site and status
- Maintenance windows by device type, site or device
- Traffic from NetFlow, IPFIX and sFlow, kept on the collector
- Audit log of sign-ins and changes, with CSV export
Try it on your own network
Every collector includes a 30-day evaluation with every feature, counted from the first time it starts. Monitoring and alerts never stop because of licensing.