Devices
Find any device quickly by type, site or name, and see its history.
2 min read
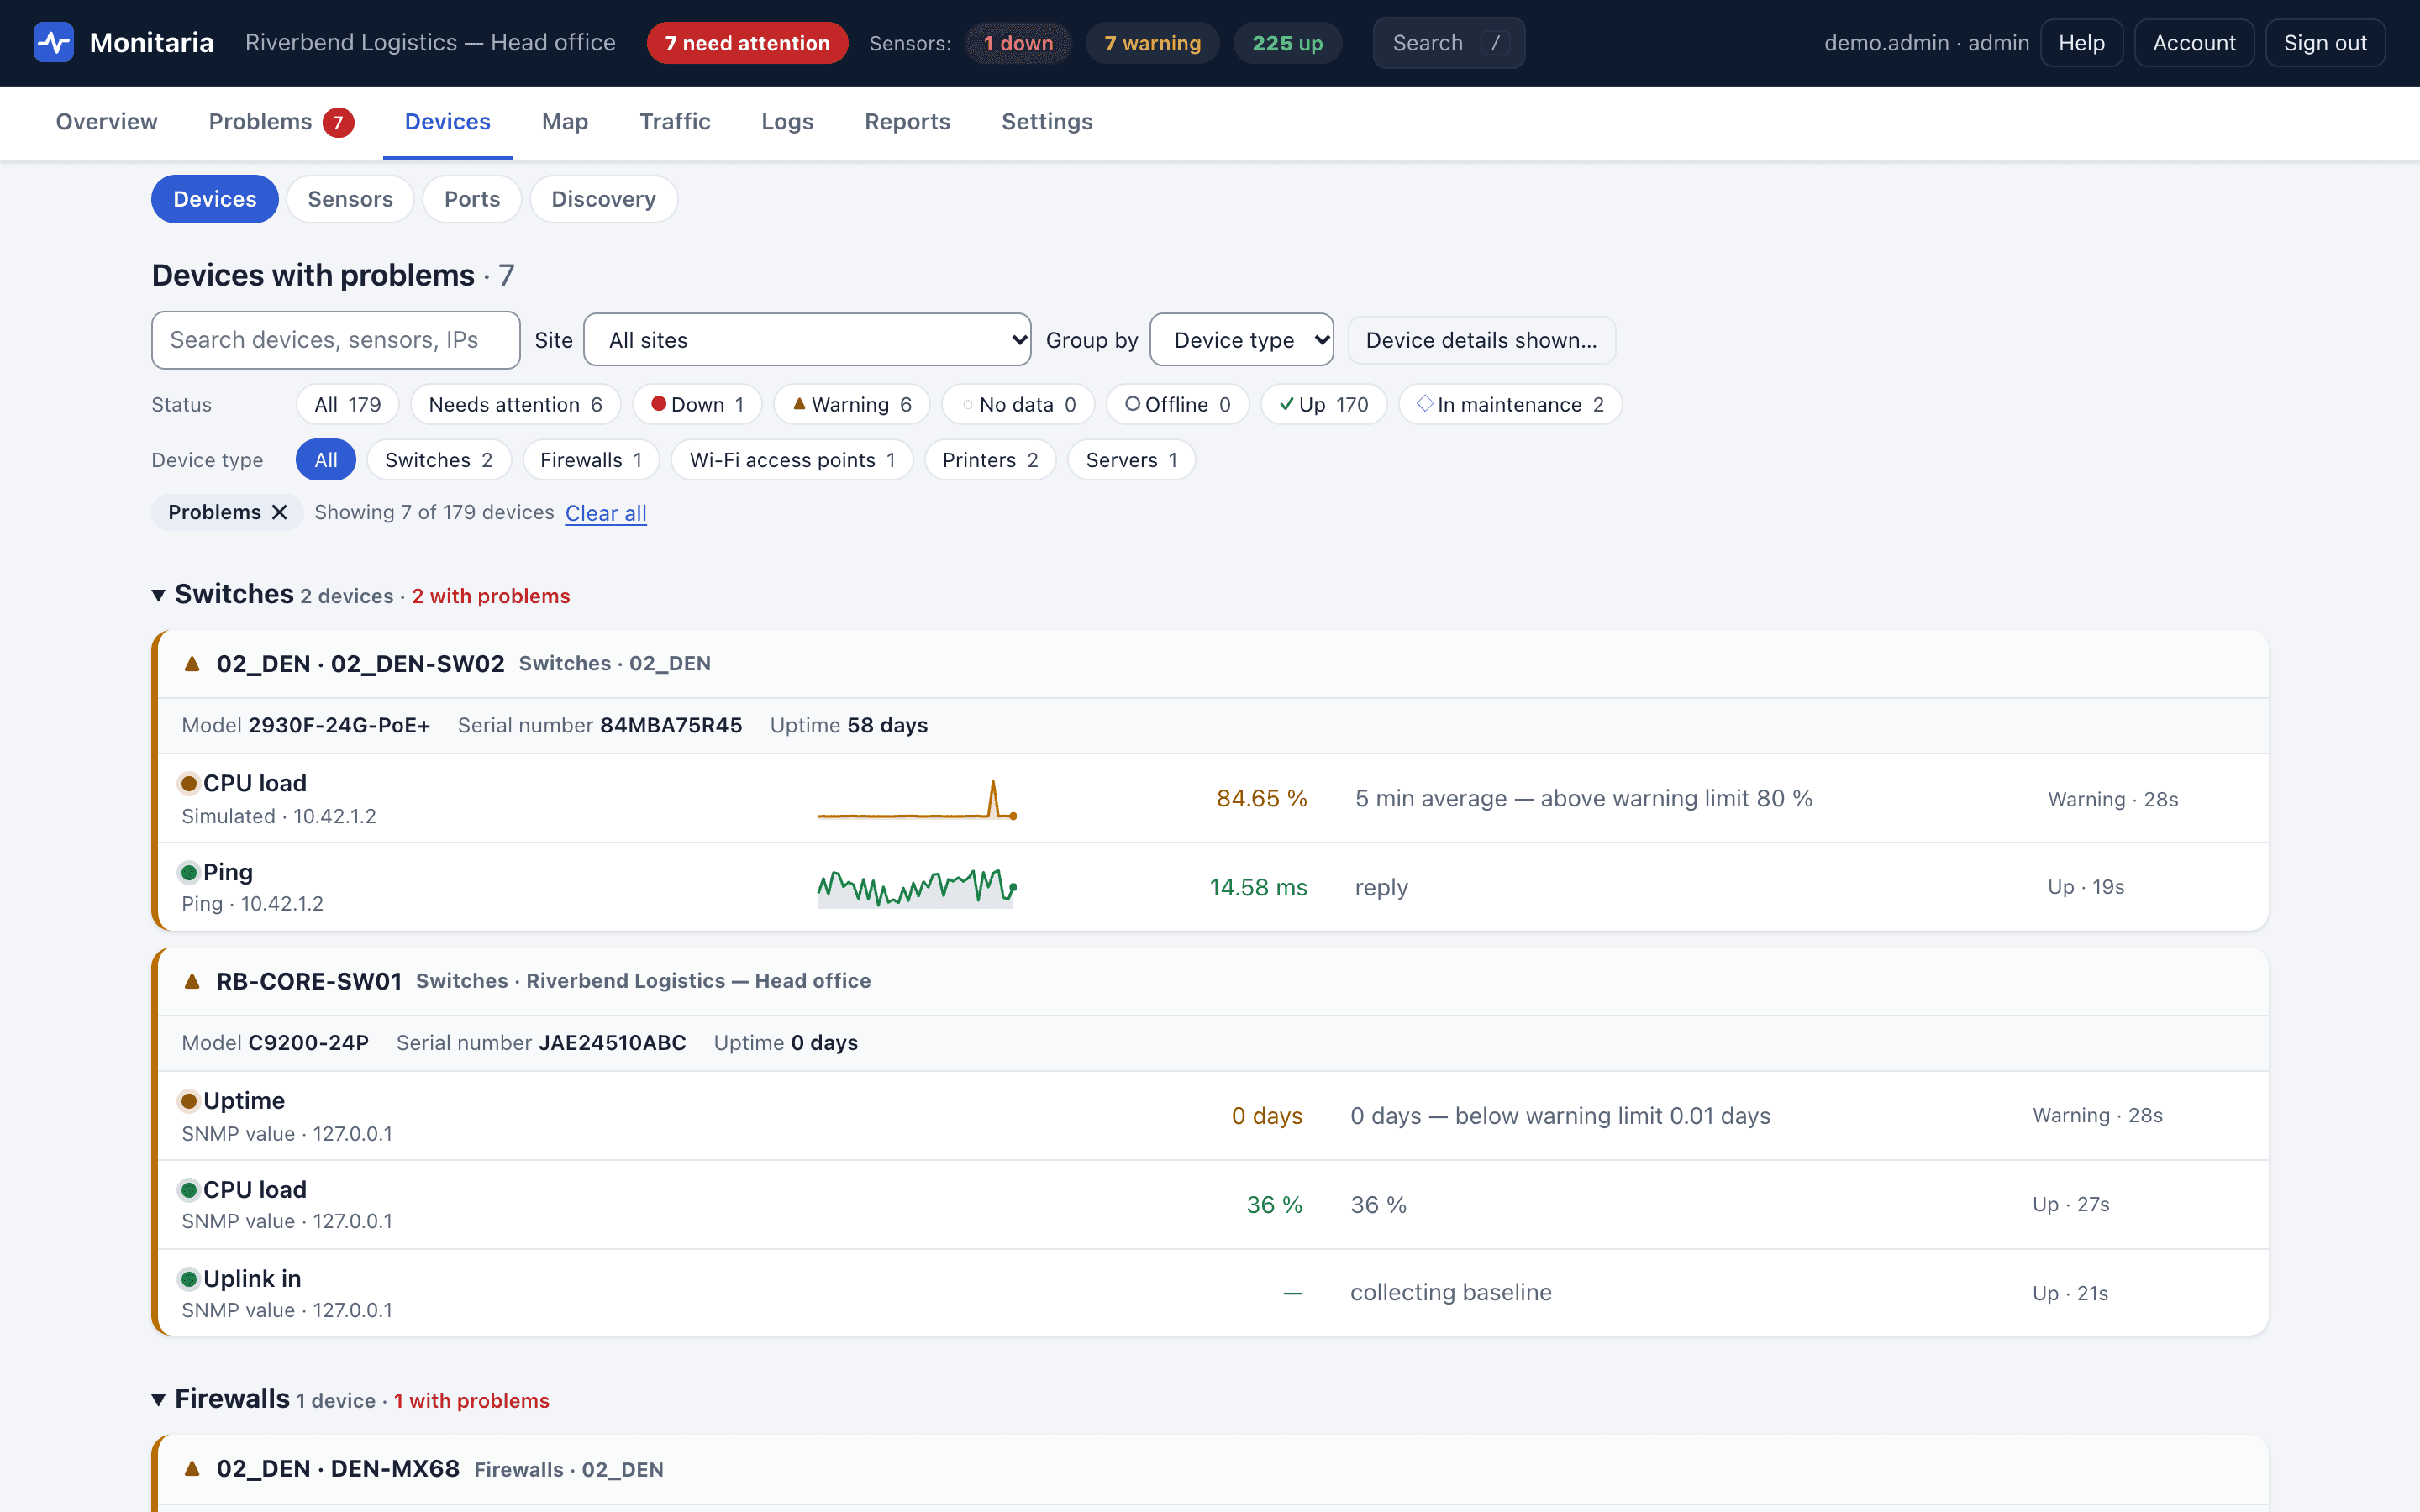
Group by device type or site (or not at all), filter with the status and device type chips or by site, and search by name or address. Click any sensor for its 24-hour chart, state changes, and (for operators) acknowledge and maintenance actions.
Device timeline
Open a device for its timeline: every status change of its checks, changes Monitaria noticed when it read the device (a new Windows update, a reboot, a firmware upgrade, a disk filling up, antivirus switched off), acknowledgements, and what people changed in Monitaria, newest first.
Connect
A device's dialog has a Connect group, worked out from its sensors, so you can go straight to the device. A sensor's own dialog and the device's card on the map have the same links.
- Open web page, for TCP 80, 443, 8080, 8443 and the like, and for a website or certificate sensor's address.
- Open SSH, for TCP 22: an ssh:// link that a Mac opens in Terminal. Copy SSH command is next to it for other computers.
- Open Remote Desktop, for TCP 3389: a small .rdp file holding only the address, which Windows opens with Remote Desktop and a Mac with Microsoft's Windows App. Copy address is next to it.
- These are links from your own browser, so every role sees them. The device's own sign-in still applies, and no link or file holds a user name or password. A device without such ports has no Connect group.
Show on map
Show on map in a device or sensor dialog opens the map zoomed to the device, with a ring around it and its name on a tag. A printer or PC is drawn in its group, so the group is ringed and its card marks the device's row. If a device isn't on a map yet, a note above the map says so.
Map
The Map tab draws your network from what the devices report: CDP/LLDP neighbors, and router interface descriptions. A router whose WAN interface is described as the hub (HUB_…) puts its site in the middle with every spoke around it; an interface described as the internet link marks the internet edge. Without a hub, sites that all see each other on a shared WAN are drawn around one segment, not a tangle of lines.
- Each WAN link shows both directions: the half next to a site is traffic leaving it, the other half traffic arriving, each coloured by load against the interface speed (under 50%, 50–80%, over 80%). Grey means no data, not idle. Add WAN sensors on the map to measure every router's WAN interface over SNMP.
- Healthy sites stay grey. Problems get colour plus a sign (× down, ! warnings), and only sites with something down pulse.
- Double-click a site to see inside it: WAN, routers, switches, access points, then grouped endpoints (IP phones, PCs, printers) and devices without neighbor data. Dashed lines and boxes are seen by one end only or not monitored.
- Hover for live details; drag to rearrange (operators); positions are saved for everyone. Wall mode fills the screen and refreshes every 30 seconds.